Daniocell
setmar (otic / lateral line)
SET domain and mariner transposase fusion gene
ZFIN
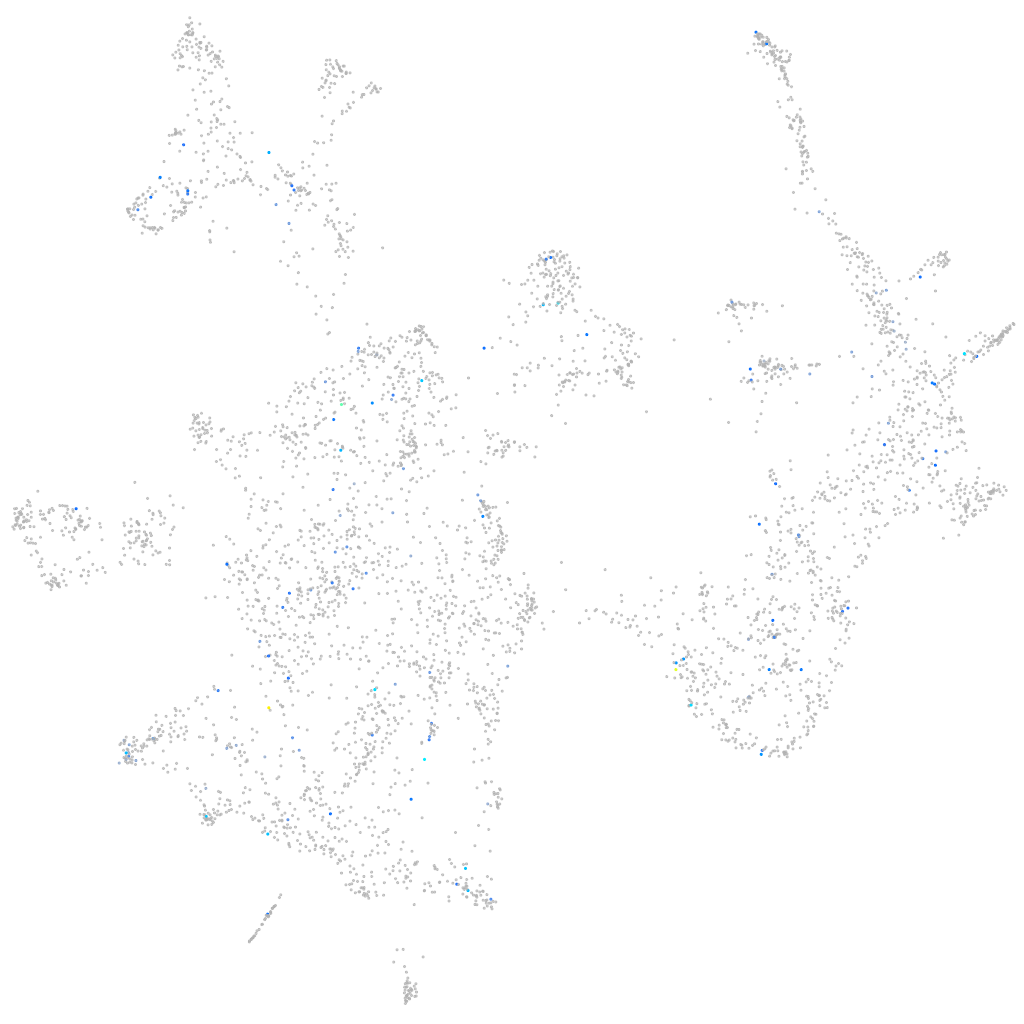
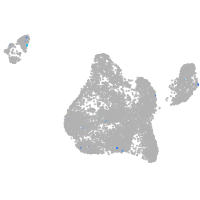
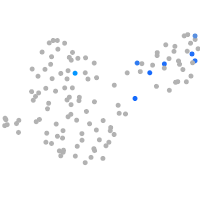
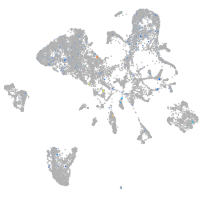
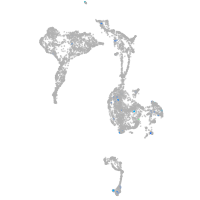
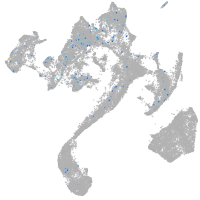
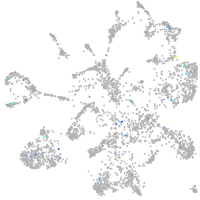
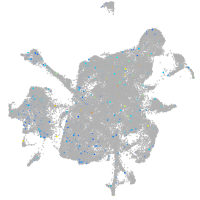
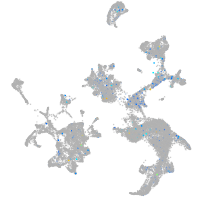
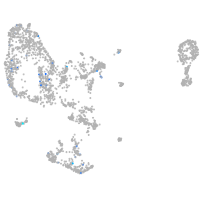
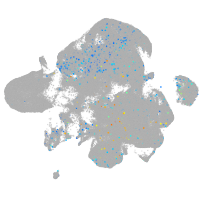
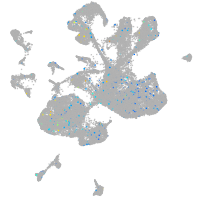
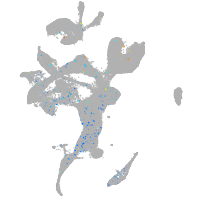
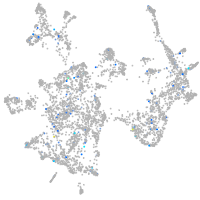
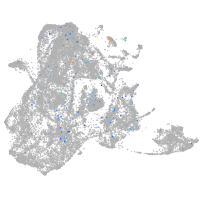
Gene expression UMAP
Display:
Expression
Stage
Other cell groups
all cells
blastomeres
PGCs
endoderm
axial mesoderm
muscle
mural cells /
non-skeletal muscle
mesenchyme
hematopoietic /
vasculature
pronephros
neural
spinal cord / glia
eye
taste / olfactory
otic / lateral line
epidermis
periderm
fin
ionocytes / mucous
pigment cells
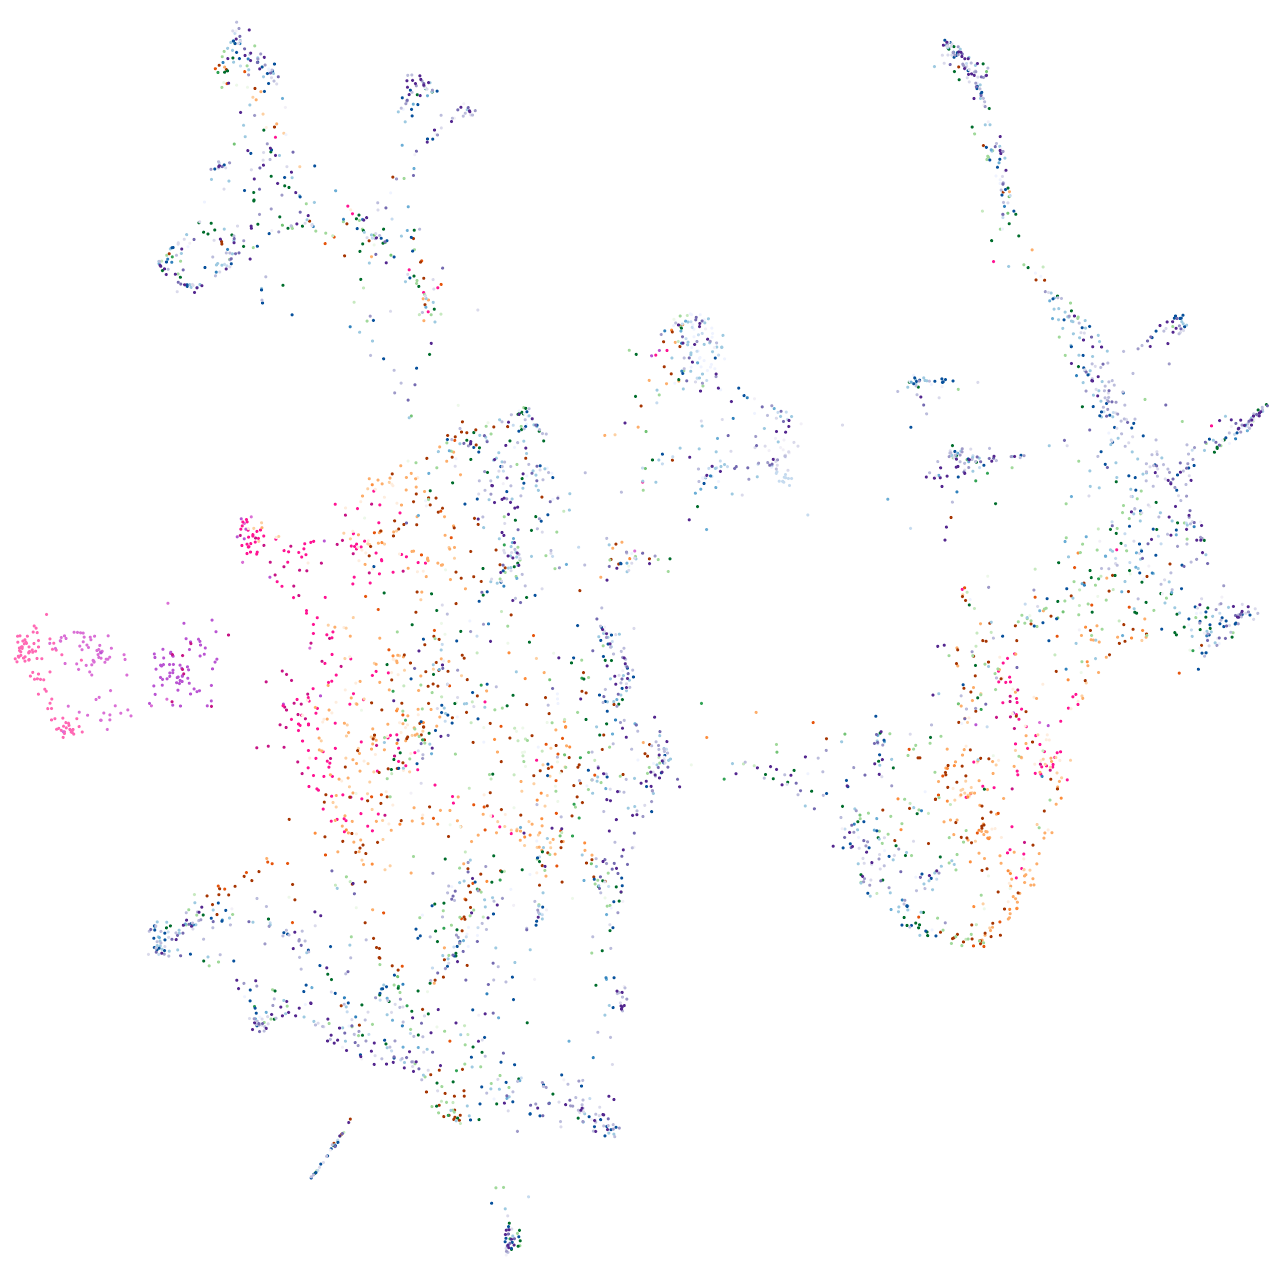
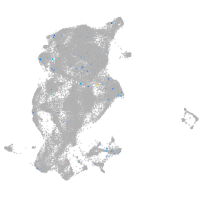
Expression by stage/cluster
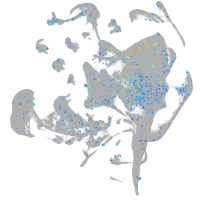
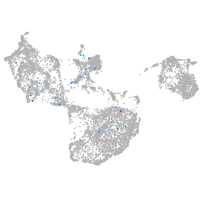
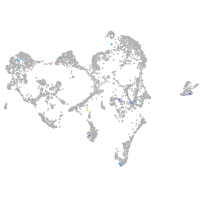
Correlated gene expression
Positive correlation
Negative correlation
Gene
r
Gene
r
si:dkey-33i11.1
0.193
NC-002333.17
-0.046
socs1b
0.179
psmb1
-0.043
LOC110440150
0.167
rcc1
-0.038
pimr65
0.164
copz1
-0.034
ccl33.2
0.156
knop1
-0.034
LOC110438469
0.155
lyar
-0.034
XLOC-029389
0.154
uhrf1
-0.033
si:dkey-33o22.1
0.145
rbm6
-0.032
LOC108180805
0.139
zgc:110339
-0.031
mkxb
0.139
CABZ01075068.1
-0.031
gpr78a
0.137
ppid
-0.031
XLOC-004483
0.134
si:dkey-250d21.1
-0.031
si:dkey-219e20.2
0.133
eif4ebp3l
-0.031
CT573787.1
0.132
snrpc
-0.031
LOC100536156
0.128
lmx1bb
-0.031
si:dkey-16p19.1
0.126
arcn1b
-0.031
LOC110438472
0.125
trmt13
-0.031
vsir
0.123
rab11fip1a
-0.031
CR352226.1
0.121
tspan36
-0.031
LOC100334677
0.121
oclnb
-0.031
AL935186.9.1
0.119
tubg1
-0.031
slitrk3a
0.119
ost4
-0.030
slc39a3.1
0.117
sept6
-0.030
maza
0.116
runx1t1
-0.030
txlnba
0.115
rad23b
-0.030
adra2b
0.115
carm1
-0.030
CR388129.1
0.112
eme1
-0.030
CU693368.1
0.109
sap30l
-0.030
tmem245
0.107
igf2bp1
-0.030
BX323560.1
0.106
cyp20a1
-0.030
BX546500.1
0.106
nr6a1a
-0.029
slc27a2a
0.106
ifi45
-0.029
pcdh2aa15
0.104
hypk
-0.029
FP067442.1
0.102
tspan9b
-0.029
six9
0.098
tmem106ba
-0.029