Daniocell
scai (blastomeres)
suppressor of cancer cell invasion
ZFIN
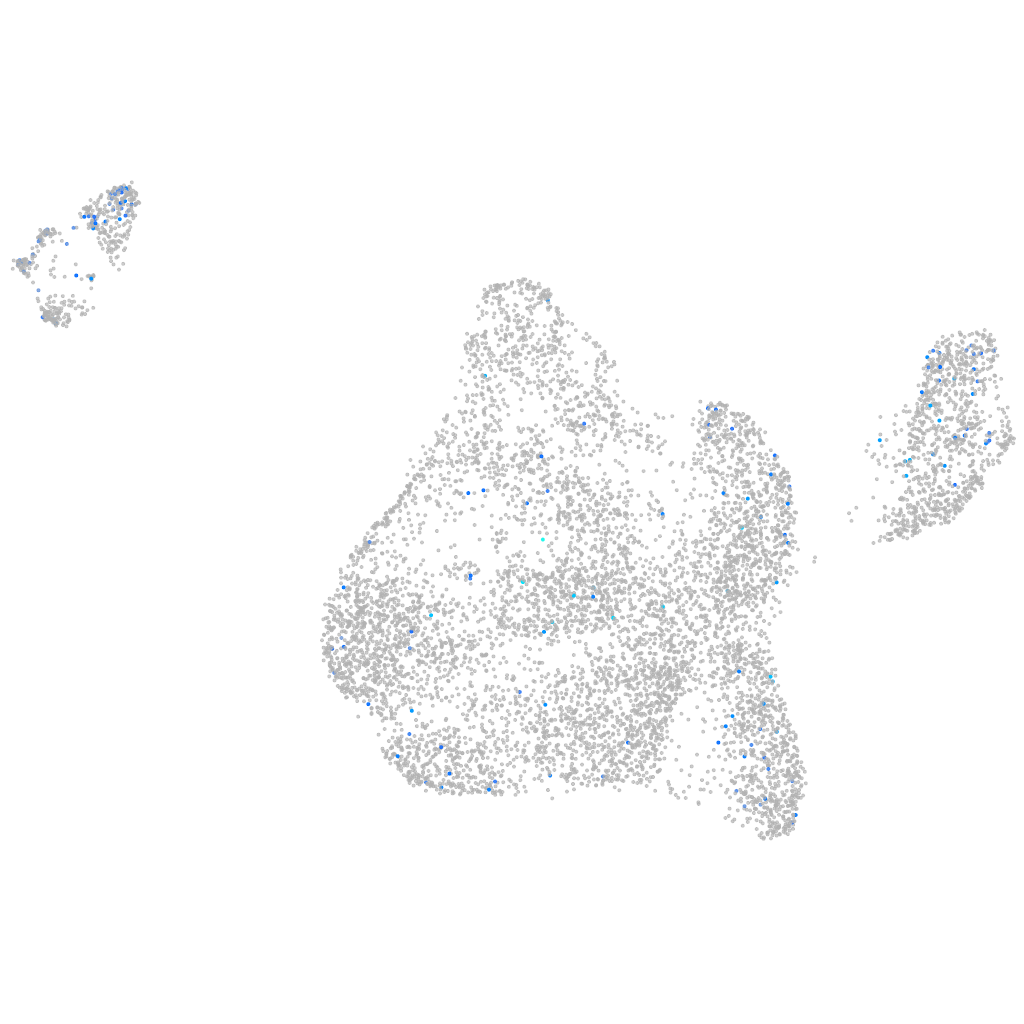
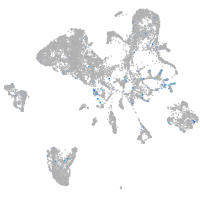
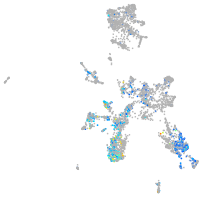
Gene expression UMAP
Display:
Expression
Stage
Other cell groups
all cells
blastomeres
PGCs
endoderm
axial mesoderm
muscle
mural cells /
non-skeletal muscle
mesenchyme
hematopoietic /
vasculature
pronephros
neural
spinal cord / glia
eye
taste / olfactory
otic / lateral line
epidermis
periderm
fin
ionocytes / mucous
pigment cells
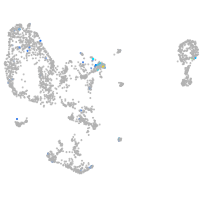
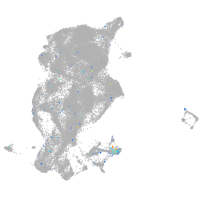
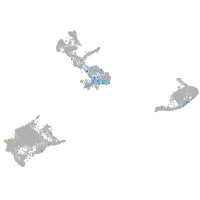
Expression by stage/cluster
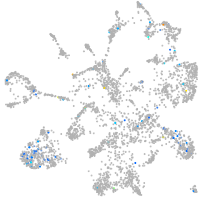
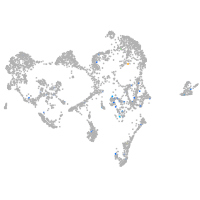
Correlated gene expression
Positive correlation
Negative correlation
Gene
r
Gene
r
LOC110438075
0.131
dynll1
-0.093
LOC101886384
0.125
hspb1
-0.089
nptx2b
0.118
stm
-0.085
epn3b
0.111
si:dkey-151g10.6
-0.083
si:ch211-168d23.3
0.110
hnrnpa0b
-0.082
LO018508.1
0.109
khdrbs1a
-0.079
zmp:0000000606
0.106
eef1a1l1
-0.076
or109-13
0.105
rplp1
-0.075
efna2b
0.104
ybx1
-0.073
LOC103909828
0.104
si:ch73-1a9.3
-0.073
trim108
0.101
marcksl1b
-0.072
p2ry12
0.096
si:ch211-222l21.1
-0.072
zgc:153395
0.095
rps19
-0.071
tex33
0.094
hmga1a
-0.071
mid1ip1l
0.093
cox7c
-0.070
LOC110438027
0.093
ptmab
-0.070
AL954322.2
0.090
si:ch211-152c2.3
-0.069
XLOC-038343
0.090
rplp2l
-0.067
cpeb4b
0.089
hmgb2a
-0.066
ska2
0.089
polr3gla
-0.065
arhgef18a
0.088
cirbpb
-0.065
nek1
0.088
rpl35a
-0.064
btg4
0.086
rps21
-0.063
rp1l1b
0.086
rpl36
-0.062
CABZ01069022.2
0.085
rpl39
-0.062
zgc:113424
0.085
rps15a
-0.062
h2af1al
0.084
rpl7a
-0.062
acp5a
0.084
rpl15
-0.061
si:ch211-132b12.8
0.084
anp32a
-0.061
cldng
0.083
apoeb
-0.061
XLOC-026582
0.083
rps4x
-0.061
ankrd12
0.083
aldob
-0.060
slc25a25a
0.082
rps13
-0.060
mknk2a
0.082
rpl36a
-0.060
cldnd
0.082
snrpd1
-0.060