Daniocell
rtel1 (otic / lateral line)
regulator of telomere elongation helicase 1
ZFIN
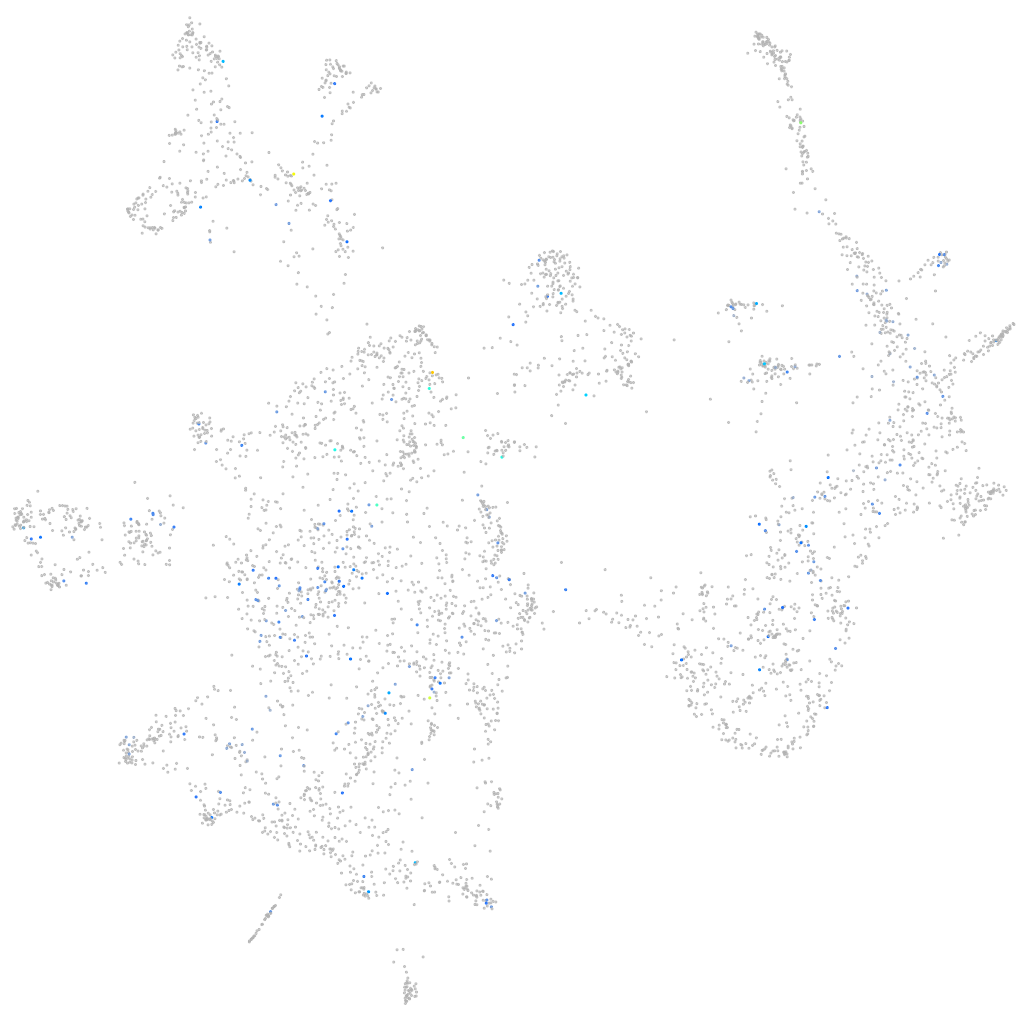
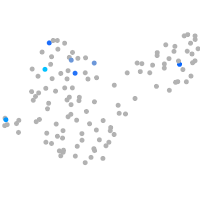
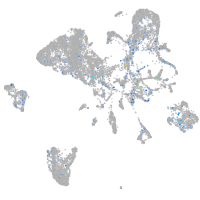
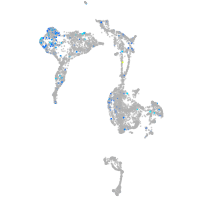
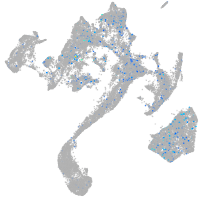
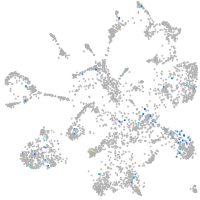
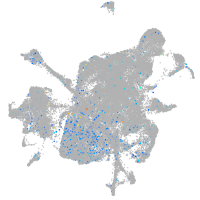
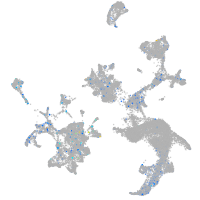
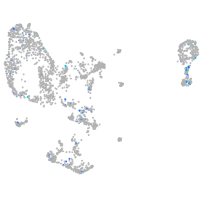
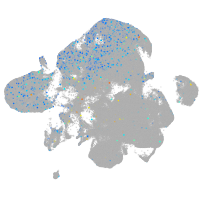
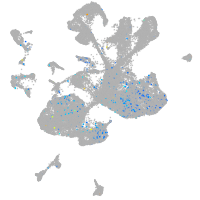
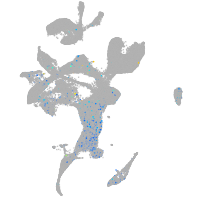
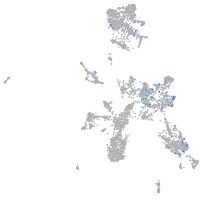
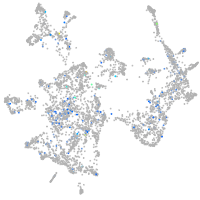
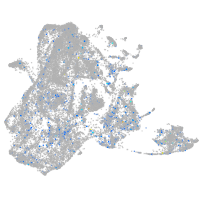
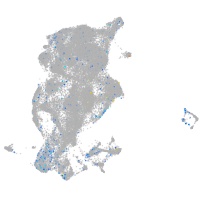
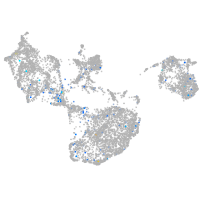
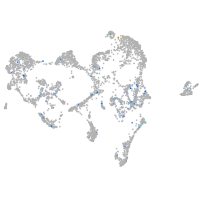
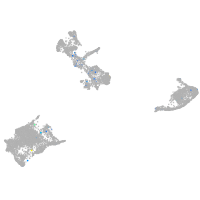
Gene expression UMAP
Display:
Expression
Stage
Other cell groups
all cells
blastomeres
PGCs
endoderm
axial mesoderm
muscle
mural cells /
non-skeletal muscle
mesenchyme
hematopoietic /
vasculature
pronephros
neural
spinal cord / glia
eye
taste / olfactory
otic / lateral line
epidermis
periderm
fin
ionocytes / mucous
pigment cells
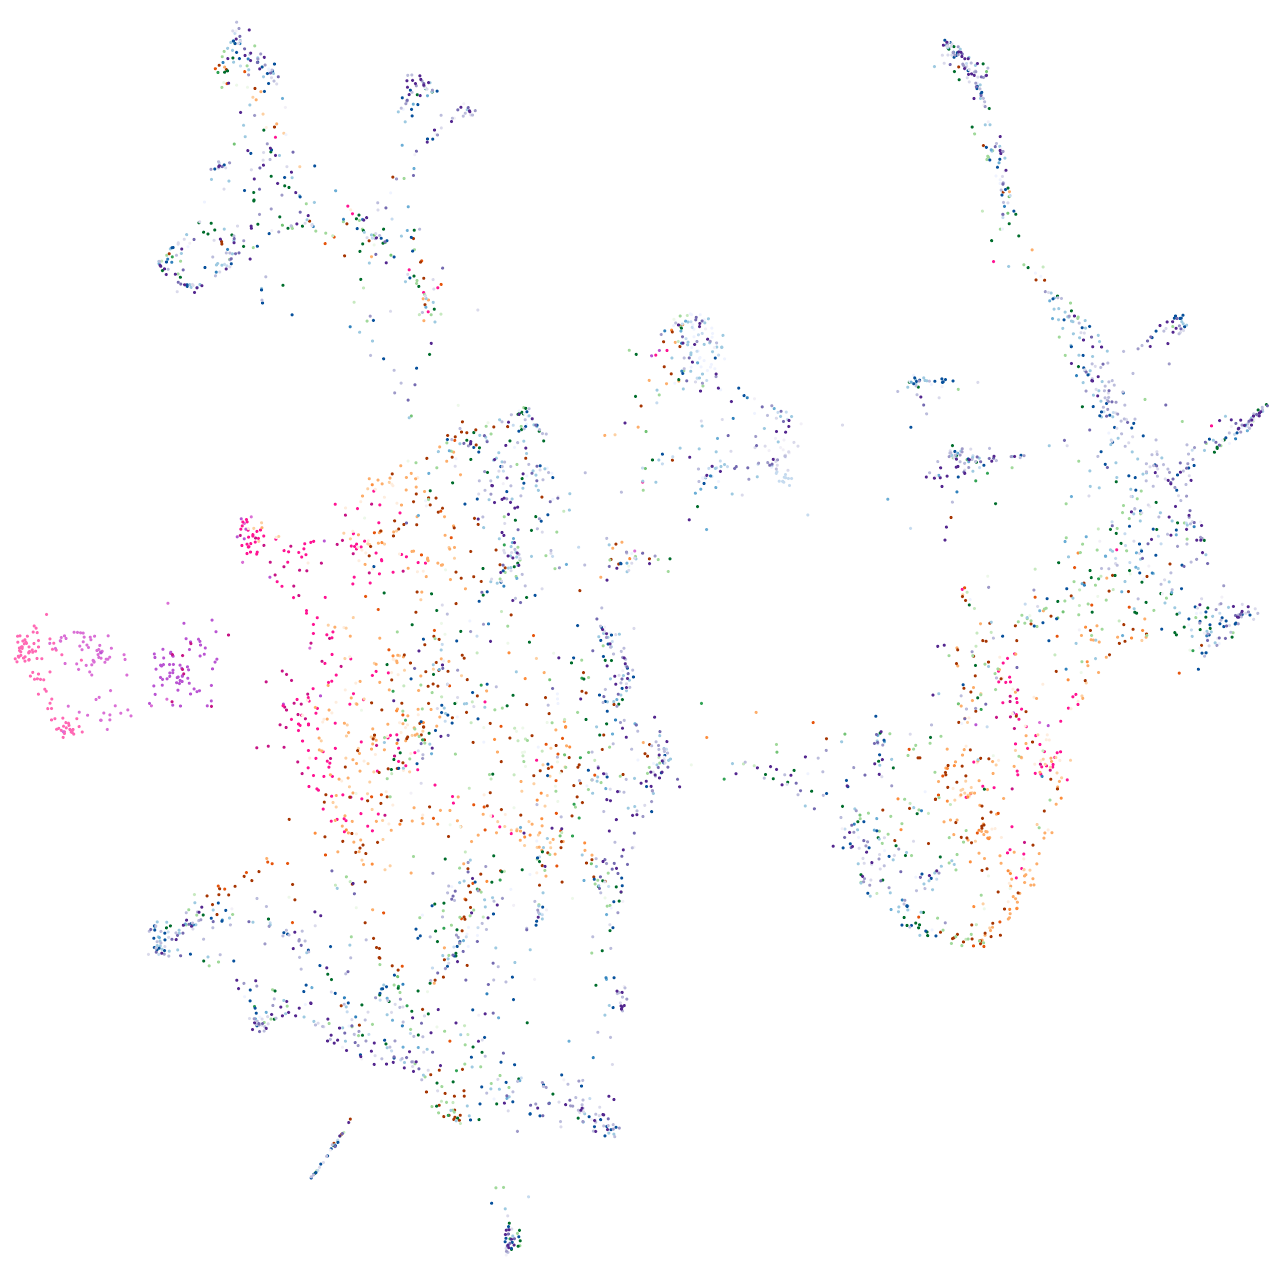
Expression by stage/cluster
Correlated gene expression
Positive correlation
Negative correlation
Gene
r
Gene
r
LO018568.2
0.217
nupr1a
-0.060
CR385053.2
0.207
tpi1b
-0.055
LOC108179989
0.207
prss59.2
-0.046
LOC110440040
0.203
atp6v1e1b
-0.046
XLOC-041356
0.194
mylz3
-0.045
XLOC-019042
0.193
ckma
-0.044
nme4
0.173
pvalb2
-0.044
LOC103910625
0.172
gb:eh456644
-0.042
LOC110439533
0.167
ctrb1
-0.042
BX323590.3
0.162
pnrc2
-0.042
si:ch73-281i18.4
0.154
pgam1a
-0.041
il21r.1
0.152
si:dkeyp-46h3.1
-0.041
si:ch211-186e20.7
0.150
plekhb2
-0.040
si:ch211-161h7.4
0.148
si:dkey-11c5.11
-0.040
XLOC-041394
0.146
fthl28
-0.040
slc12a10.3
0.145
pvalb1
-0.039
XLOC-022277
0.144
mical2b
-0.038
pik3c2g
0.141
mcl1a
-0.038
XLOC-008303
0.139
foxj1a
-0.037
XLOC-038946
0.138
twf2a
-0.037
grxcr1a
0.138
adipor2
-0.037
CU457778.1
0.137
si:ch211-195b15.8
-0.037
si:ch73-252i11.1
0.135
tpi1a
-0.037
gcna
0.134
selenow2b
-0.036
mibp
0.133
apoa2
-0.036
znfl1g
0.132
fthl27
-0.036
slc4a3
0.131
proza
-0.036
slc35a3b
0.130
si:ch211-193l2.10
-0.036
si:dkey-222p3.1
0.130
tbc1d14
-0.036
entpd2a.1
0.129
spa17
-0.036
gb:ee300746
0.127
map1lc3b
-0.035
bmp15
0.127
tmem42a
-0.035
cenph
0.125
nupr1b
-0.035
nacad
0.125
pgk1
-0.035
LOC101885599
0.125
si:ch211-218o21.4
-0.035