Daniocell
rsph4a (blastomeres)
radial spoke head component 4A
ZFIN
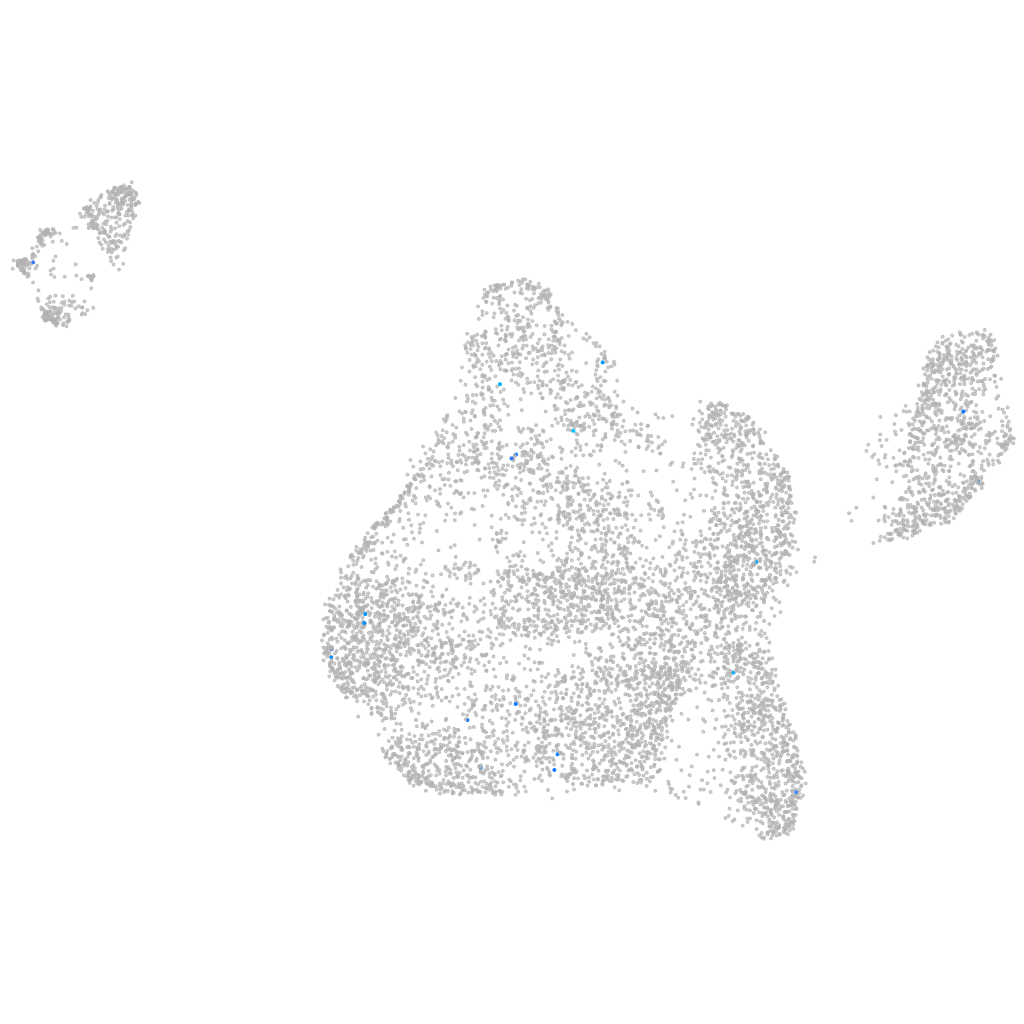
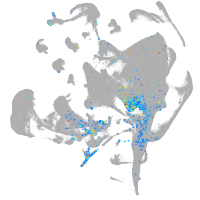
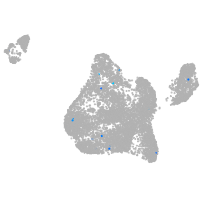
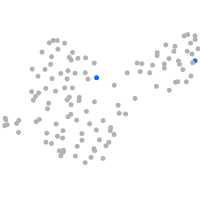
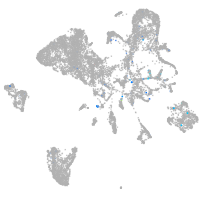
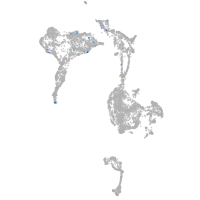
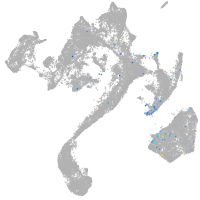
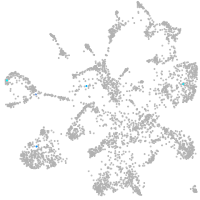
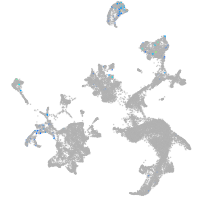
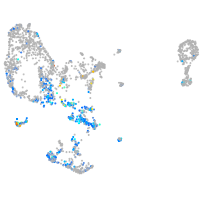
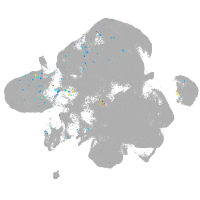
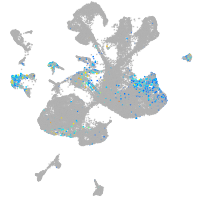
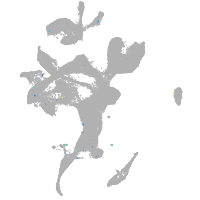
Gene expression UMAP
Display:
Expression
Stage
Other cell groups
all cells
blastomeres
PGCs
endoderm
axial mesoderm
muscle
mural cells /
non-skeletal muscle
mesenchyme
hematopoietic /
vasculature
pronephros
neural
spinal cord / glia
eye
taste / olfactory
otic / lateral line
epidermis
periderm
fin
ionocytes / mucous
pigment cells
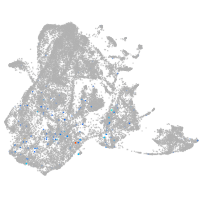
Expression by stage/cluster
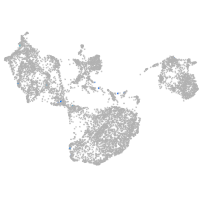
Correlated gene expression
Positive correlation
Negative correlation
Gene
r
Gene
r
BX545917.5
0.324
snrnp48
-0.030
LOC108183743
0.284
lamp2
-0.026
CR513782.1
0.246
rbm39b
-0.026
FP016018.3
0.242
med10
-0.023
CT583723.2
0.239
si:ch73-144d13.4
-0.023
si:dkey-261j11.2
0.226
zgc:66427
-0.022
si:ch211-161h7.8
0.217
gm2a
-0.022
col10a1a
0.199
nelfcd
-0.021
CR354444.2
0.194
ier2b
-0.021
lrrc4.1
0.190
rpn1
-0.021
LOC103910643
0.187
nxt2
-0.021
BX004840.1
0.184
atg13
-0.021
LOC101885541
0.162
elocb
-0.020
fhad1
0.160
si:ch211-152c8.5
-0.020
dnah3
0.153
si:ch211-155e24.3
-0.020
bscl2l
0.148
si:ch211-225h24.2
-0.020
XLOC-030247
0.144
dnajb12a
-0.020
sb:cb37
0.141
rab35b
-0.020
ahsg2
0.137
eno3
-0.020
isl2a
0.127
si:dkey-23f9.4
-0.020
si:dkey-15h8.17
0.127
phb
-0.020
cx32.2
0.120
twistnb
-0.020
CR936408.2
0.112
sugt1
-0.019
BX511093.1
0.112
zgc:77086
-0.019
si:dkey-14o6.1
0.112
snu13a
-0.019
LOC101882959
0.112
pdlim1
-0.019
hes2.1
0.111
clstn1
-0.019
CR392341.1
0.110
bola3
-0.019
CR925761.1
0.109
dus2
-0.019
btbd16
0.107
ercc6
-0.019
LOC567521
0.107
eif3ea
-0.019
egr2b
0.107
znf1035
-0.019
CABZ01032906.1
0.104
polr2h
-0.019
magi2a
0.104
vrk3
-0.019
kcnh7
0.103
yipf5
-0.019