Daniocell
rreb1b (blastomeres)
ras responsive element binding protein 1b
ZFIN
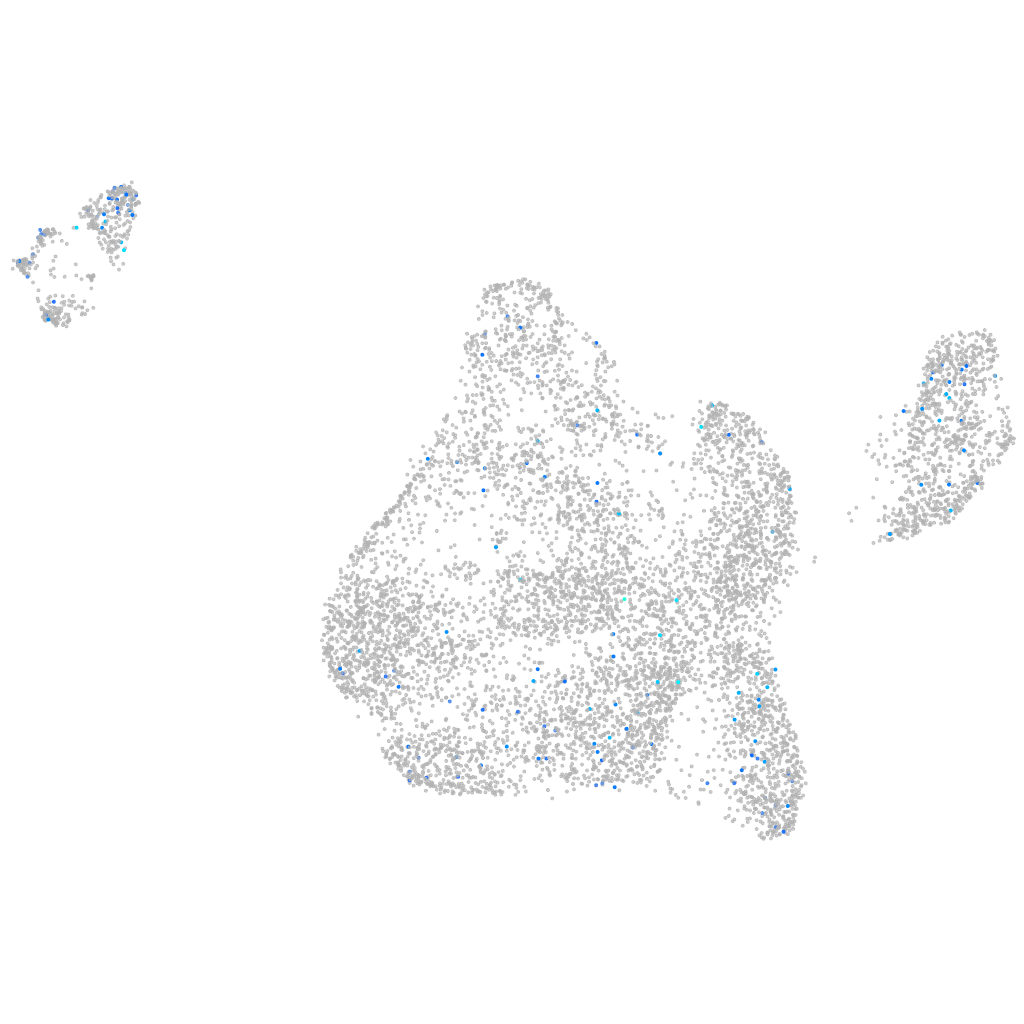
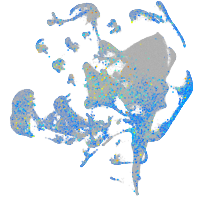
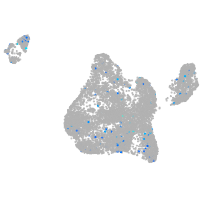
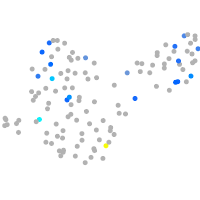
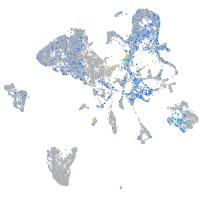
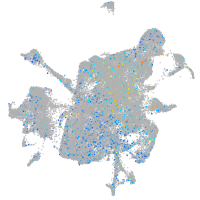
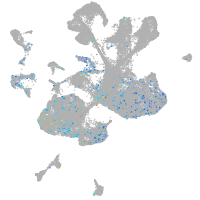
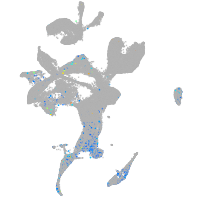
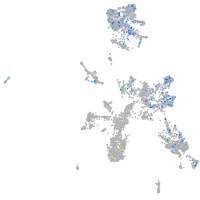
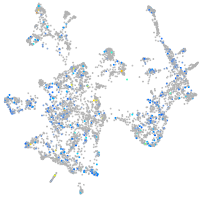
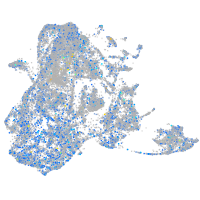
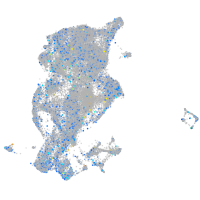
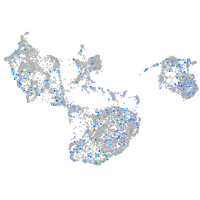
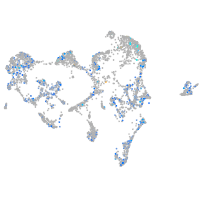
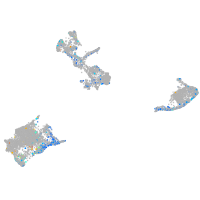
Gene expression UMAP
Display:
Expression
Stage
Other cell groups
all cells
blastomeres
PGCs
endoderm
axial mesoderm
muscle
mural cells /
non-skeletal muscle
mesenchyme
hematopoietic /
vasculature
pronephros
neural
spinal cord / glia
eye
taste / olfactory
otic / lateral line
epidermis
periderm
fin
ionocytes / mucous
pigment cells
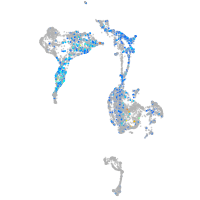
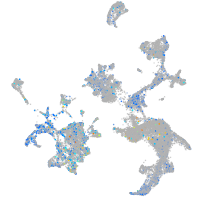
Expression by stage/cluster
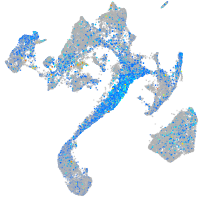
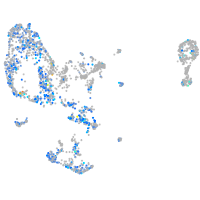
Correlated gene expression
Positive correlation
Negative correlation
Gene
r
Gene
r
LOC108183933
0.148
hnrnpa0b
-0.077
tgfbr3
0.136
srsf5a
-0.073
CR848665.1
0.122
si:ch73-1a9.3
-0.071
LOC101883361
0.115
dynll1
-0.071
CABZ01046996.1
0.113
hspb1
-0.067
CR762407.2
0.111
eef1a1l1
-0.064
prrt2
0.108
marcksl1b
-0.064
si:ch211-168d23.3
0.107
aldob
-0.062
FO904885.2
0.107
npm1a
-0.062
cbln14
0.106
si:dkey-151g10.6
-0.061
slc32a1
0.099
polr3gla
-0.061
frem1a
0.099
stm
-0.060
CABZ01059099.1
0.097
si:ch211-222l21.1
-0.060
BX324212.1
0.096
khdrbs1a
-0.055
FO834888.1
0.096
si:ch211-152c2.3
-0.055
herc7
0.095
rpl39
-0.053
si:ch211-132p1.3
0.094
rpl36a
-0.053
rec8a
0.092
rplp1
-0.053
si:ch211-93f2.1
0.092
rps19
-0.053
fbxl3l
0.091
rps18
-0.053
brinp1
0.089
rpl7a
-0.052
shbg
0.084
cirbpb
-0.052
crygm6
0.083
hmgb2a
-0.051
rgs2
0.083
rps27.1
-0.051
FP067442.1
0.083
hmga1a
-0.050
rsph3
0.082
fthl27
-0.049
AL935299.1
0.081
rpl26
-0.049
FP103106.1
0.081
rplp0
-0.049
nfic
0.081
hmgn2
-0.048
si:ch211-145c1.1
0.079
rpl30
-0.047
CR377211.1
0.078
ncl
-0.047
CR392012.1
0.078
srsf3b
-0.047
LOC108183498
0.078
rps15
-0.047
smoc2
0.077
tubb2b
-0.046
si:dkey-152b24.8
0.076
rps23
-0.046