RAS related 2
ZFIN 
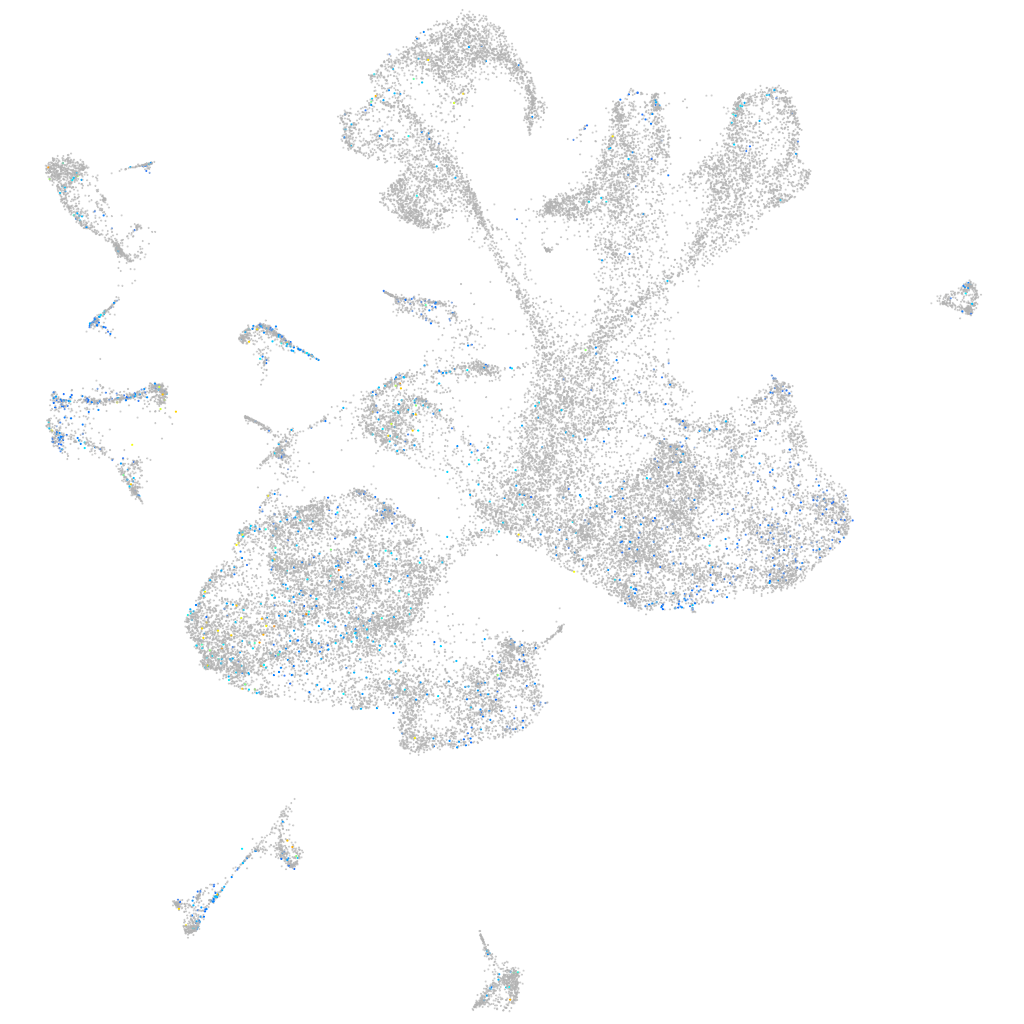
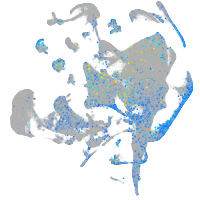
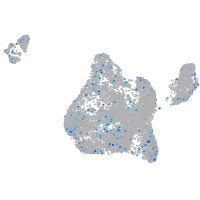
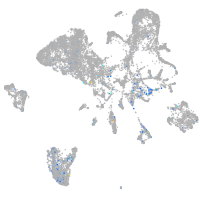
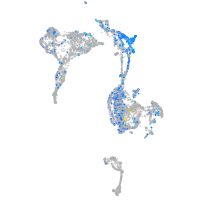
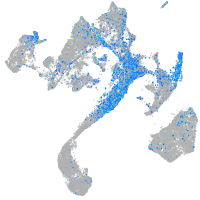
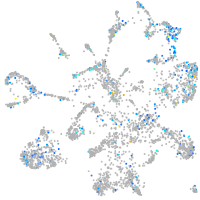
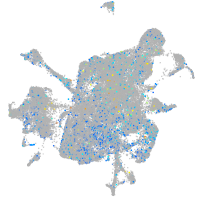
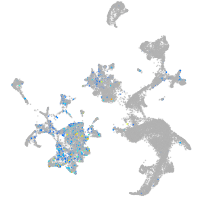
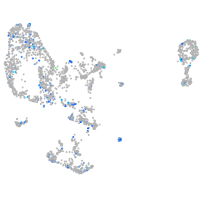
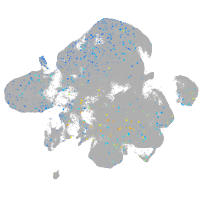
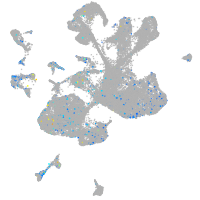
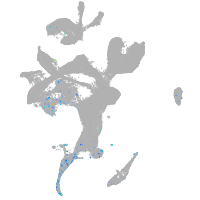
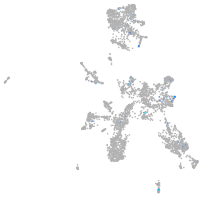
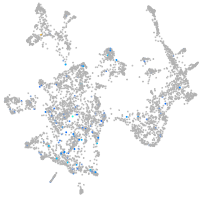
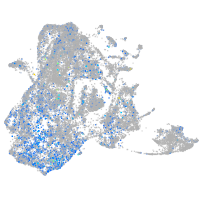
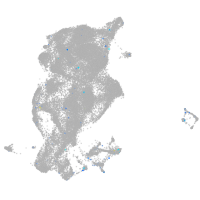
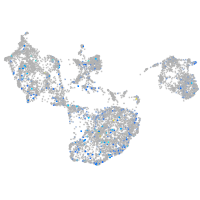
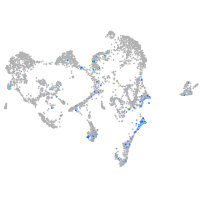
Expression by stage/cluster


Correlated gene expression


| Positive correlation | Negative correlation | ||
| Gene | r | Gene | r |
| igfbp7 | 0.085 | ptmab | -0.077 |
| qki2 | 0.082 | elavl3 | -0.067 |
| cnn2 | 0.079 | h3f3d | -0.066 |
| npr3 | 0.075 | si:ch211-222l21.1 | -0.064 |
| b3gnt7l | 0.073 | myt1b | -0.063 |
| rspo3 | 0.073 | hmgb3a | -0.062 |
| fkbp14 | 0.072 | si:ch73-1a9.3 | -0.059 |
| tpm4a | 0.072 | cirbpb | -0.059 |
| anxa13 | 0.072 | hmgb1b | -0.059 |
| cd63 | 0.072 | tmsb | -0.058 |
| slit2 | 0.072 | tmeff1b | -0.057 |
| anxa4 | 0.070 | si:ch211-288g17.3 | -0.056 |
| wls | 0.070 | hnrnpaba | -0.056 |
| chl1a | 0.069 | myt1a | -0.054 |
| rrbp1b | 0.068 | ptmaa | -0.053 |
| aplnr2 | 0.068 | si:ch211-57n23.4 | -0.053 |
| spon2a | 0.068 | marcksb | -0.052 |
| ptn | 0.068 | tubb2b | -0.052 |
| sulf1 | 0.068 | sox11b | -0.052 |
| optc | 0.068 | si:ch73-386h18.1 | -0.052 |
| asph | 0.068 | tp53inp2 | -0.051 |
| p4hb | 0.067 | epb41a | -0.051 |
| rap1b | 0.067 | scrt2 | -0.050 |
| hepacama | 0.067 | fabp3 | -0.050 |
| spon1b | 0.067 | chd4a | -0.049 |
| col8a1a | 0.066 | dlb | -0.048 |
| npc2 | 0.066 | LOC100537384 | -0.046 |
| ahnak | 0.066 | nhlh2 | -0.046 |
| col9a3 | 0.065 | tubb5 | -0.046 |
| atp1b1a | 0.065 | stmn1b | -0.046 |
| ctgfa | 0.065 | LOC798783 | -0.046 |
| rcn3 | 0.064 | hmgn2 | -0.046 |
| pmp22a | 0.064 | hnrnpa0l | -0.045 |
| gpc1b | 0.064 | h3f3a | -0.045 |
| fxyd1 | 0.064 | rtn1a | -0.045 |


