Daniocell
rragca (fin)
Ras-related GTP binding Ca
ZFIN
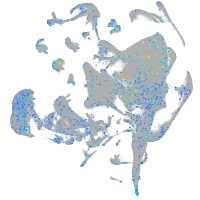
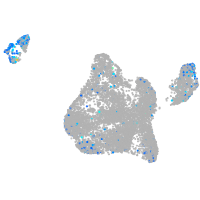
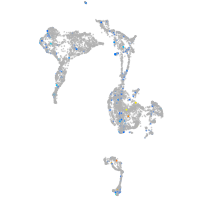
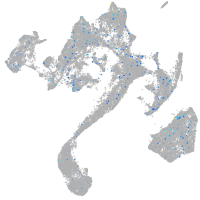
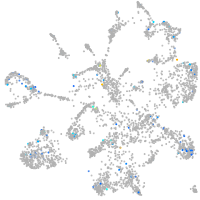
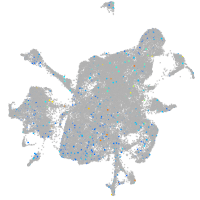
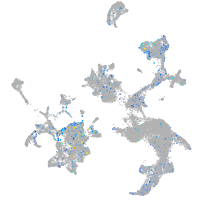
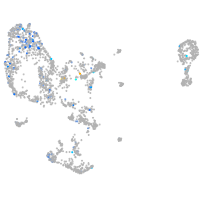
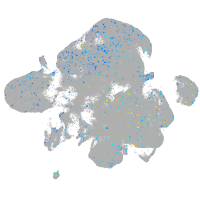
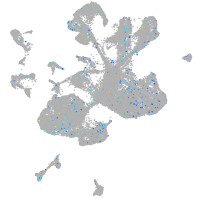
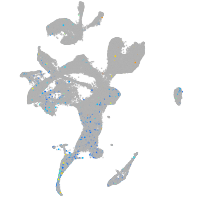
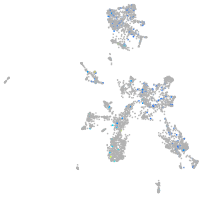
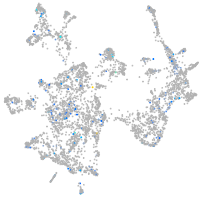
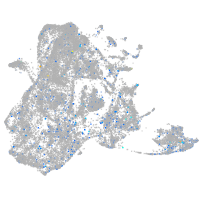
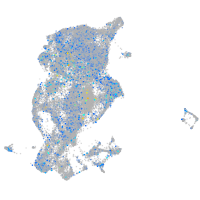
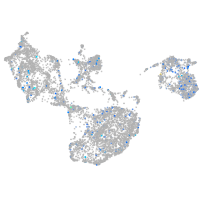
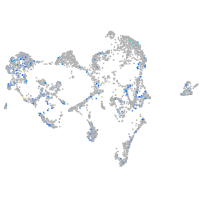
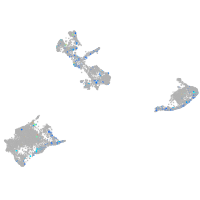
Gene expression UMAP
Display:
Expression
Stage
Other cell groups
all cells
blastomeres
PGCs
endoderm
axial mesoderm
muscle
mural cells /
non-skeletal muscle
mesenchyme
hematopoietic /
vasculature
pronephros
neural
spinal cord / glia
eye
taste / olfactory
otic / lateral line
epidermis
periderm
fin
ionocytes / mucous
pigment cells
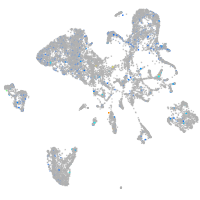
Expression by stage/cluster
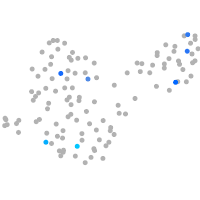
Correlated gene expression
Positive correlation
Negative correlation
Gene
r
Gene
r
BX004816.2
0.127
actc1b
-0.044
si:ch211-205a14.3
0.124
pvalb2
-0.040
FP102892.1
0.120
zgc:158463
-0.039
LOC110439480
0.117
hbae3
-0.038
gdf9
0.116
hpdb
-0.037
si:dkey-27l15.1
0.116
hgd
-0.036
LOC108190755
0.115
tnmd
-0.033
abca12
0.113
pvalb1
-0.032
zgc:111983
0.111
cyp26a1
-0.031
sft2d2a
0.109
zgc:162396
-0.031
si:ch211-125o16.4
0.108
spon2b
-0.030
cldnb
0.107
snupn
-0.029
mhc1zka
0.106
XLOC-023492
-0.029
p2rx8
0.106
gstz1
-0.029
BX005129.4
0.106
ptx3a
-0.029
LOC103910665
0.106
apoa1b
-0.029
elovl7a
0.105
XLOC-020301
-0.029
arap1a
0.104
lhx9
-0.028
CABZ01072487.2
0.103
ucp1
-0.028
tmem45b
0.103
NC-002333.4
-0.028
mrc1b
0.103
mark4a
-0.027
selenow2b
0.102
bgnb
-0.027
scel
0.101
reck
-0.027
XLOC-041945
0.101
ckma
-0.027
smtnl1
0.100
nme2b.2
-0.027
si:ch211-207n23.2
0.100
ttc36
-0.027
si:ch73-52f15.5
0.099
sept15
-0.027
si:dkey-27h10.2
0.099
grem1b
-0.027
erbb3a
0.098
efnb1
-0.026
znf185
0.098
bhmt
-0.026
si:ch73-337l15.2
0.097
LOC100538221
-0.026
stx11b.1
0.097
hbbe1.3
-0.026
lye
0.097
pah
-0.025
icn2
0.097
LOC100535130
-0.025
crb3b
0.097
ponzr1
-0.025