Daniocell
rpp30 (otic / lateral line)
ribonuclease P/MRP 30 subunit
ZFIN
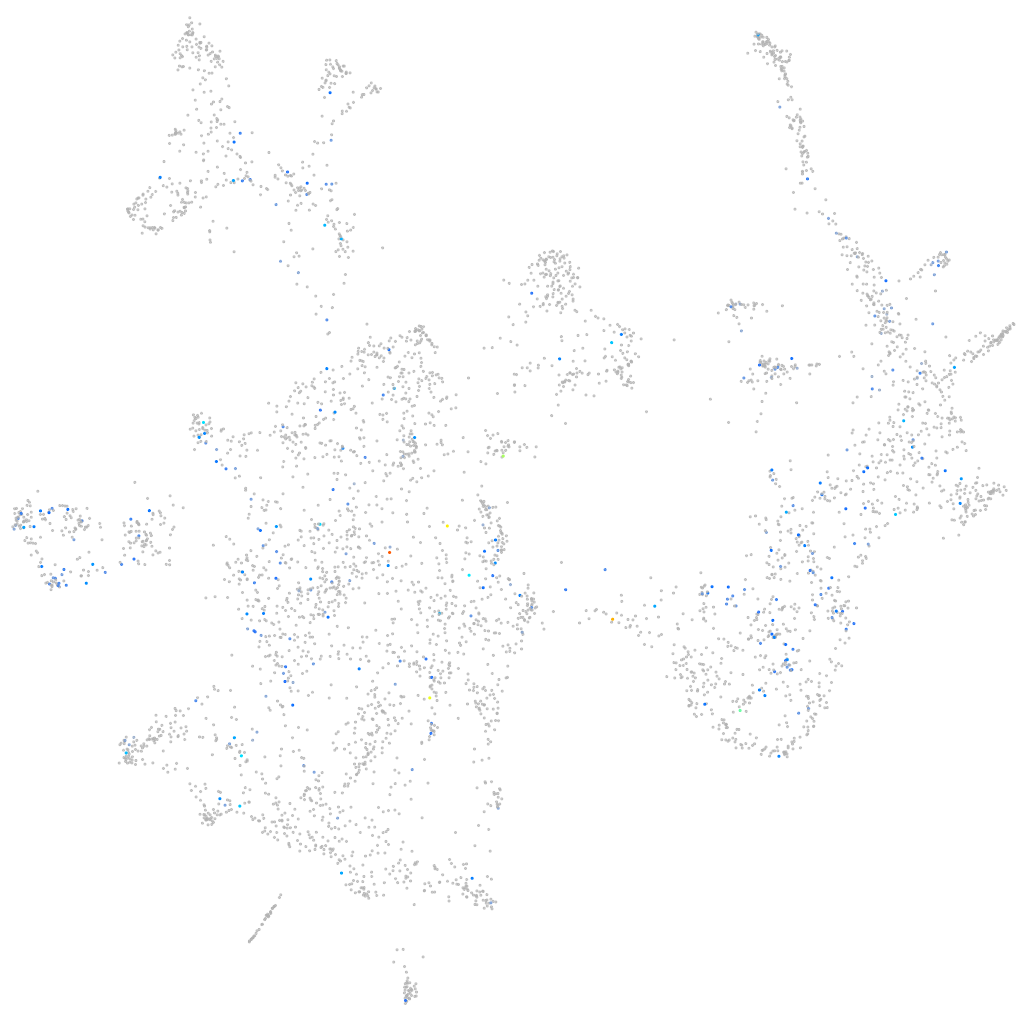
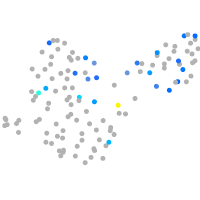
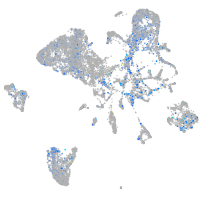
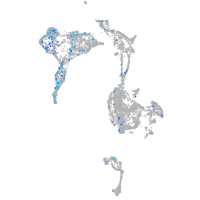
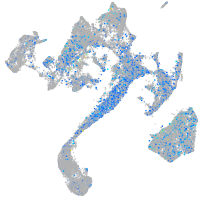
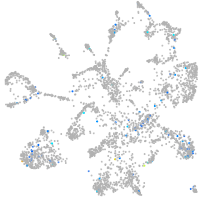
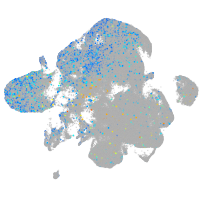
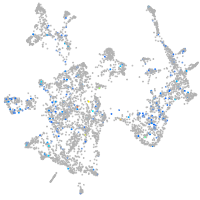
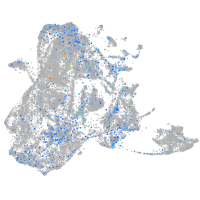
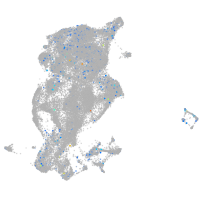
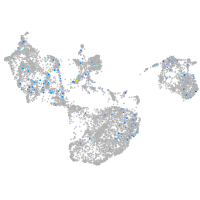
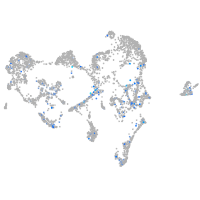
Gene expression UMAP
Display:
Expression
Stage
Other cell groups
all cells
blastomeres
PGCs
endoderm
axial mesoderm
muscle
mural cells /
non-skeletal muscle
mesenchyme
hematopoietic /
vasculature
pronephros
neural
spinal cord / glia
eye
taste / olfactory
otic / lateral line
epidermis
periderm
fin
ionocytes / mucous
pigment cells
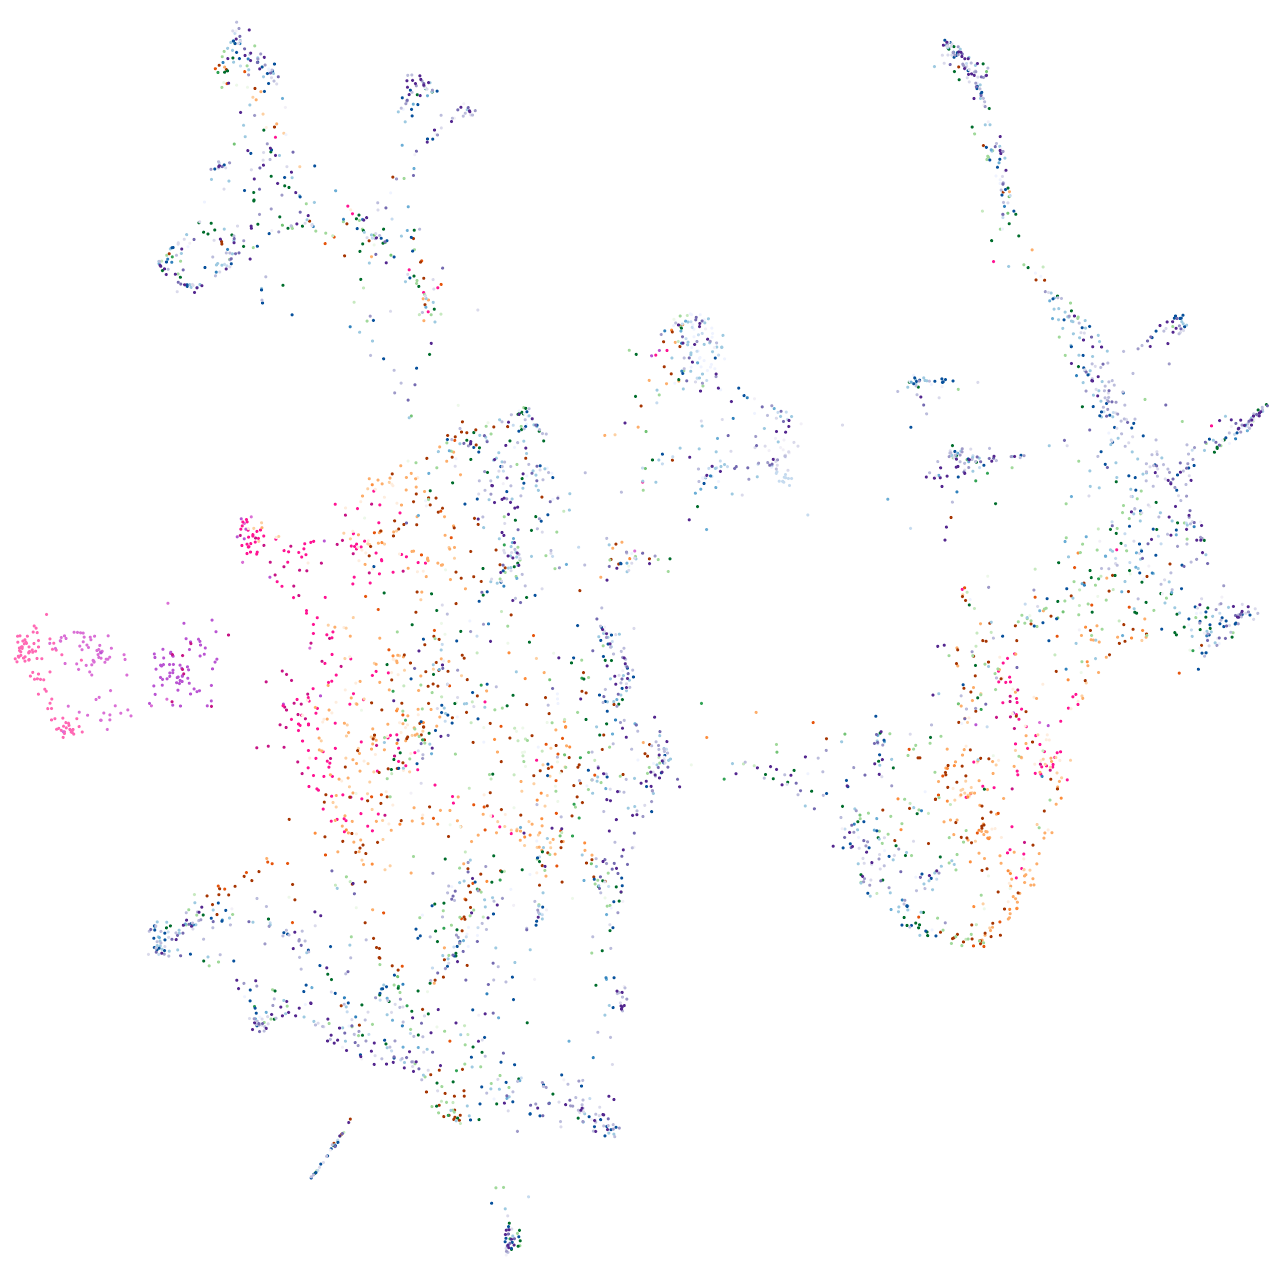
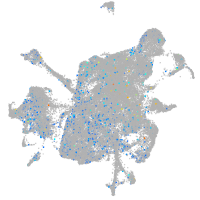
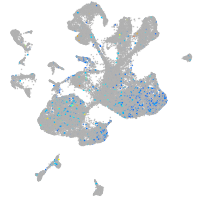
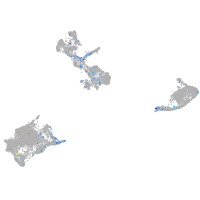
Expression by stage/cluster
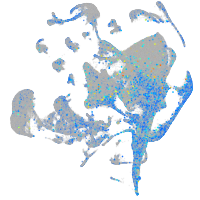
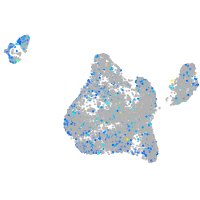
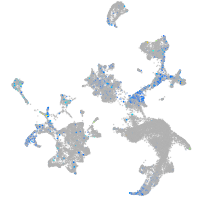
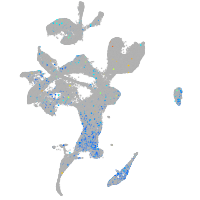
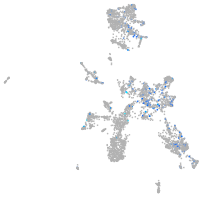
Correlated gene expression
Positive correlation
Negative correlation
Gene
r
Gene
r
BX323559.4
0.173
atp6v1e1b
-0.067
CR385053.2
0.168
col11a2
-0.062
LOC108179989
0.168
zgc:92606
-0.062
LOC110440040
0.165
atpv0e2
-0.060
XLOC-039766
0.164
tpi1b
-0.059
si:ch211-195j11.30
0.160
hbbe1.1
-0.058
XLOC-041356
0.157
ccni
-0.058
LOC101884209
0.155
si:ch211-140m22.7
-0.056
irge1
0.155
LOC110439372
-0.056
LOC110437917
0.153
prss35
-0.055
si:dkey-108k24.2
0.151
b2ml
-0.055
crygm2d6
0.143
creb3l3l
-0.055
wdr55
0.141
ip6k2a
-0.054
prmt1
0.139
si:dkey-11c5.11
-0.052
tbx19
0.138
atp2b1a
-0.052
LOC103911496
0.137
cpeb4b
-0.051
LOC103910625
0.135
gabarapl2
-0.050
npm1a
0.128
eno1a
-0.050
bysl
0.126
col9a1a
-0.050
si:dkey-23a13.11
0.125
col9a3
-0.050
hnrnpabb
0.124
vamp8
-0.050
snu13b
0.124
kif1aa
-0.050
pwp2h
0.123
ppdpfb
-0.050
cdh7b
0.121
matn4
-0.049
fbl
0.117
thbs1b
-0.049
pa2g4a
0.116
h1f0
-0.049
ncl
0.115
nme2b.2
-0.048
dkc1
0.114
col11a1a
-0.048
snrpb
0.114
col2a1a
-0.048
ddx39ab
0.114
calm1b
-0.048
ran
0.113
gpia
-0.048
kif23
0.112
osbpl1a
-0.048
XLOC-022277
0.112
col9a2
-0.048
tomm40l
0.111
ier2b
-0.048
XLOC-008303
0.111
ckbb
-0.048