ring finger protein 11b
ZFIN 
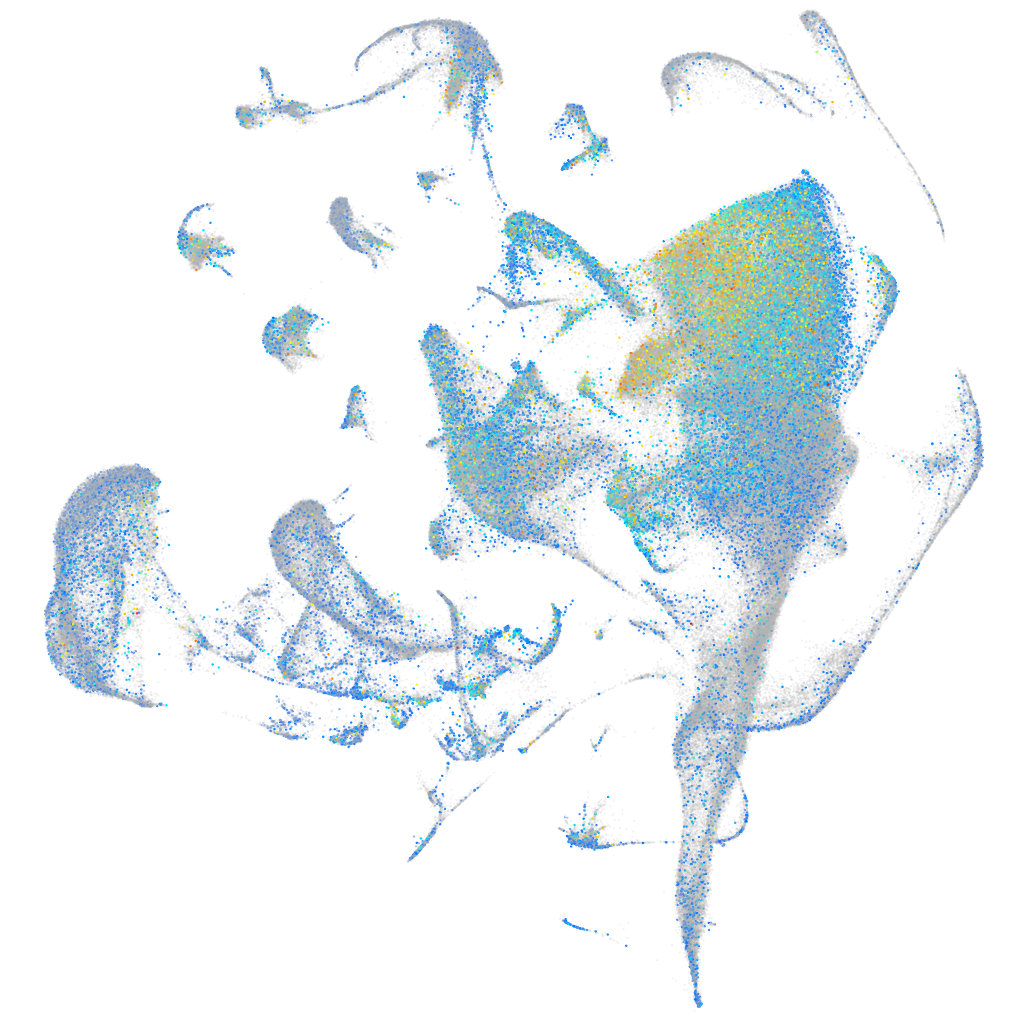
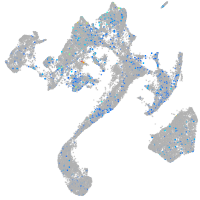
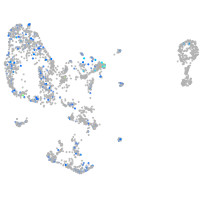
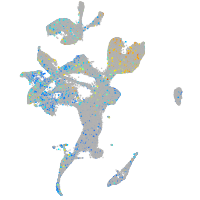
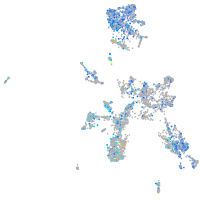
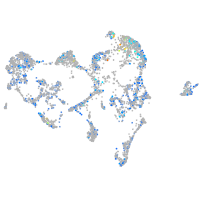
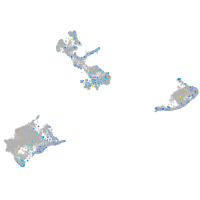
Expression by stage/cluster


Correlated gene expression


| Positive correlation | Negative correlation | ||
| Gene | r | Gene | r |
| ckbb | 0.103 | hspb1 | -0.086 |
| gpm6aa | 0.099 | npm1a | -0.086 |
| rnasekb | 0.099 | nop58 | -0.083 |
| elavl3 | 0.093 | dkc1 | -0.081 |
| atp6v1e1b | 0.092 | banf1 | -0.079 |
| gabarapb | 0.092 | fbl | -0.079 |
| atp6v0cb | 0.091 | lig1 | -0.079 |
| rtn1a | 0.091 | pcna | -0.079 |
| stmn1b | 0.091 | chaf1a | -0.075 |
| gpm6ab | 0.090 | snu13b | -0.071 |
| nova2 | 0.090 | anp32b | -0.070 |
| ndrg4 | 0.089 | nop56 | -0.070 |
| scrt2 | 0.089 | nop2 | -0.069 |
| jpt1b | 0.088 | gar1 | -0.067 |
| myt1b | 0.088 | ddx18 | -0.066 |
| atp6v1g1 | 0.087 | gnl3 | -0.066 |
| epb41a | 0.087 | nop10 | -0.066 |
| tuba1c | 0.087 | ebna1bp2 | -0.065 |
| calm1a | 0.087 | nhp2 | -0.065 |
| tp53inp1 | 0.085 | rsl1d1 | -0.065 |
| vamp2 | 0.085 | fen1 | -0.063 |
| si:ch1073-429i10.3.1 | 0.085 | mcm6 | -0.063 |
| sox4a | 0.083 | nasp | -0.063 |
| marcksl1a | 0.083 | apoeb | -0.062 |
| fam168a | 0.082 | bms1 | -0.062 |
| myt1a | 0.080 | rrp1 | -0.062 |
| atpv0e2 | 0.079 | aldob | -0.061 |
| wu:fb55g09 | 0.079 | dek | -0.061 |
| ywhah | 0.079 | lyar | -0.061 |
| oaz1b | 0.078 | mcm3 | -0.061 |
| gng3 | 0.077 | mibp | -0.061 |
| zc4h2 | 0.077 | ncl | -0.061 |
| h1f0 | 0.076 | zmp:0000000624 | -0.061 |
| hmgb3a | 0.076 | eif4ebp3l | -0.060 |
| bcl2l10 | 0.075 | ing5b | -0.060 |


