Daniocell
ripor2 (periderm)
RHO family interacting cell polarization regulator 2
ZFIN
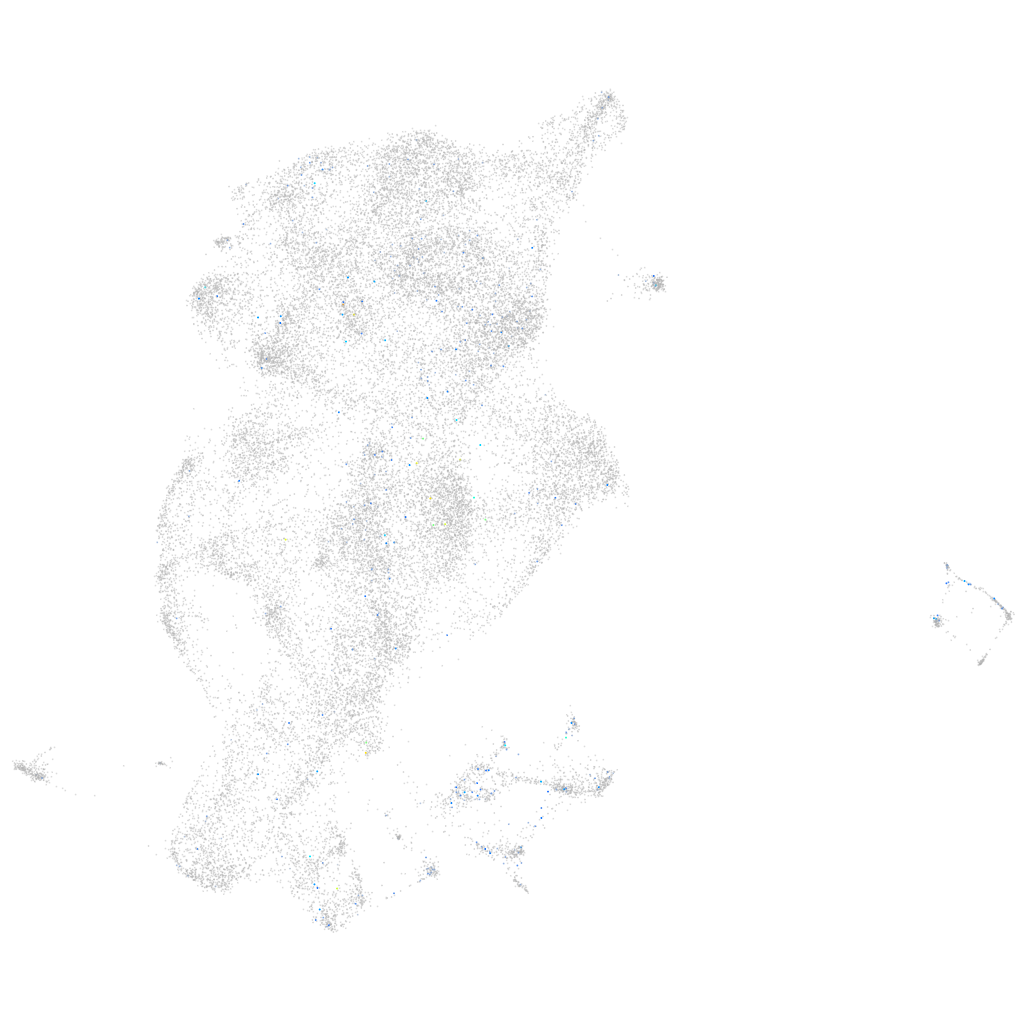
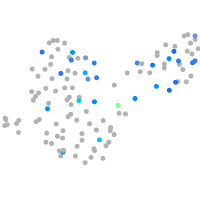
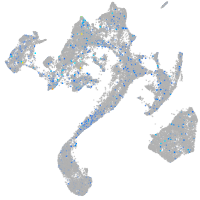
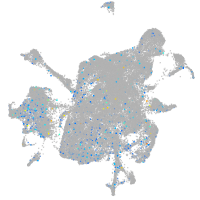
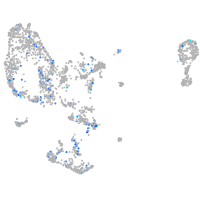
Gene expression UMAP
Display:
Expression
Stage
Other cell groups
all cells
blastomeres
PGCs
endoderm
axial mesoderm
muscle
mural cells /
non-skeletal muscle
mesenchyme
hematopoietic /
vasculature
pronephros
neural
spinal cord / glia
eye
taste / olfactory
otic / lateral line
epidermis
periderm
fin
ionocytes / mucous
pigment cells
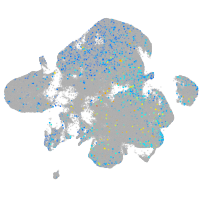
Expression by stage/cluster
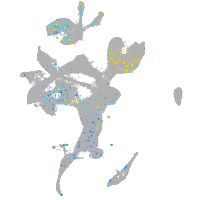
Correlated gene expression
Positive correlation
Negative correlation
Gene
r
Gene
r
cbln7
0.204
cyt1
-0.049
XLOC-018977
0.198
si:ch211-195b11.3
-0.043
inppl1b
0.138
wu:fb18f06
-0.041
si:ch211-186e20.7
0.135
icn2
-0.041
CT573337.1
0.122
rps26l
-0.039
LOC101885083
0.119
krt4
-0.037
BX322618.1
0.114
cyt1l
-0.034
LOC110438125
0.106
anxa1a
-0.034
LOC110439594
0.103
rpl36a
-0.033
dennd3b
0.101
ier2b
-0.033
AL929222.2
0.099
aldob
-0.032
zdhhc11
0.099
naca
-0.031
apcdd1l
0.099
rps10
-0.031
gpr183a
0.096
rpl17
-0.030
LOC110439939
0.096
rpl31
-0.029
XLOC-042209
0.095
rplp2
-0.029
cald1b
0.093
pycard
-0.028
LOC101884692
0.093
rpl7
-0.028
BX957322.3
0.093
tcima
-0.028
abo
0.092
rpl35a
-0.028
LOC100536670
0.092
selenow1
-0.028
frem1a
0.092
rps19
-0.027
si:ch73-233f7.5
0.090
rpl24
-0.027
si:dkey-269o24.1
0.089
rpl37
-0.027
LOC108190098
0.086
rps29
-0.027
XLOC-002639
0.086
rps27a
-0.026
pdlim5a
0.084
uba52
-0.026
nos1apb
0.084
serpinb1
-0.026
si:dkey-21e2.16
0.080
rps12
-0.026
si:dkey-85k15.6
0.080
rpl32
-0.025
macf1b
0.079
si:dkey-112e7.2
-0.025
fmodb
0.078
capns1a
-0.025
slc38a8b
0.078
ndufa6
-0.024
itga1
0.078
atp5if1b
-0.024
LOC103910333
0.078
zgc:158263
-0.024