Daniocell
rin1a (periderm)
Ras and Rab interactor 1a
ZFIN
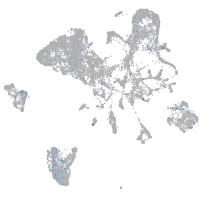
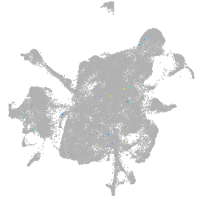
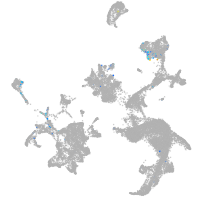
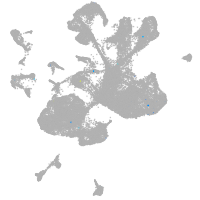
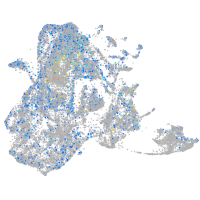
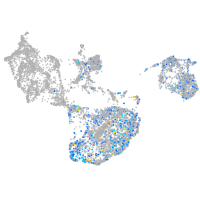
Gene expression UMAP
Display:
Expression
Stage
Other cell groups
all cells
blastomeres
PGCs
endoderm
axial mesoderm
muscle
mural cells /
non-skeletal muscle
mesenchyme
hematopoietic /
vasculature
pronephros
neural
spinal cord / glia
eye
taste / olfactory
otic / lateral line
epidermis
periderm
fin
ionocytes / mucous
pigment cells
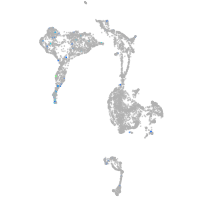
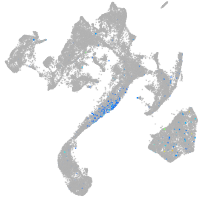
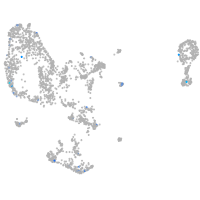
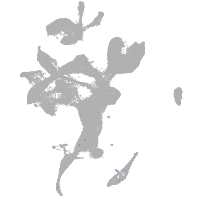
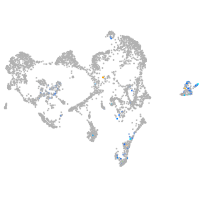
Expression by stage/cluster
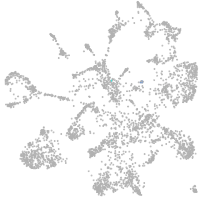
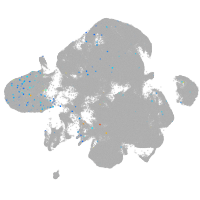
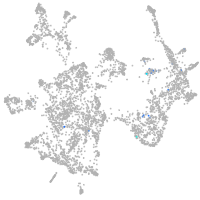
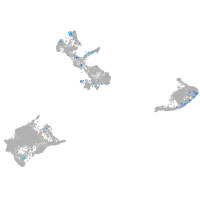
Correlated gene expression
Positive correlation
Negative correlation
Gene
r
Gene
r
best1
0.287
krt4
-0.029
epx
0.269
cyt1
-0.028
ncf4
0.224
icn2
-0.023
LOC103910869
0.191
cyt1l
-0.022
fhl5
0.182
aep1
-0.020
zgc:171965
0.155
agr1
-0.020
CR382370.1
0.152
cst14b.1
-0.018
CT025771.1
0.150
anxa1c
-0.017
BX119902.2
0.145
zgc:175088
-0.017
BX255913.1
0.144
icn
-0.016
si:dkey-71b5.6
0.135
si:ch211-195b11.3
-0.016
si:ch211-233f11.5
0.128
wu:fb18f06
-0.015
wnt5a
0.126
krt5
-0.015
nyx
0.121
fut9d
-0.015
miox
0.120
cyp2y3
-0.014
pimr183
0.116
si:dkey-184p9.7
-0.014
FO704909.1
0.116
krtt1c19e
-0.014
XLOC-036254
0.115
rpl13a
-0.014
BX510337.1
0.112
zgc:193505
-0.013
si:ch211-286b5.4
0.110
rpl37
-0.013
crygmxl1
0.108
wipf2a
-0.013
tnni2a.3
0.106
rtn3
-0.013
AL590146.1
0.104
b3gnt3.1
-0.013
btr29
0.104
rps10
-0.013
AL772146.1
0.103
homer2
-0.013
zgc:111976
0.101
zgc:114188
-0.012
LOC100148254
0.100
ikzf2
-0.012
zgc:66455
0.098
evplb
-0.012
CU927934.2
0.098
ponzr3
-0.012
scn5lab
0.097
psma8
-0.012
faah2b
0.096
XLOC-041945
-0.012
sgca
0.095
sik1
-0.012
si:ch73-138e16.3
0.093
ndufb3
-0.011
si:dkey-205i10.1
0.093
rplp2
-0.011
si:dkey-19a16.1
0.092
slc25a55a
-0.011