Daniocell
rhot1b (pigment cells)
ras homolog family member T1
ZFIN
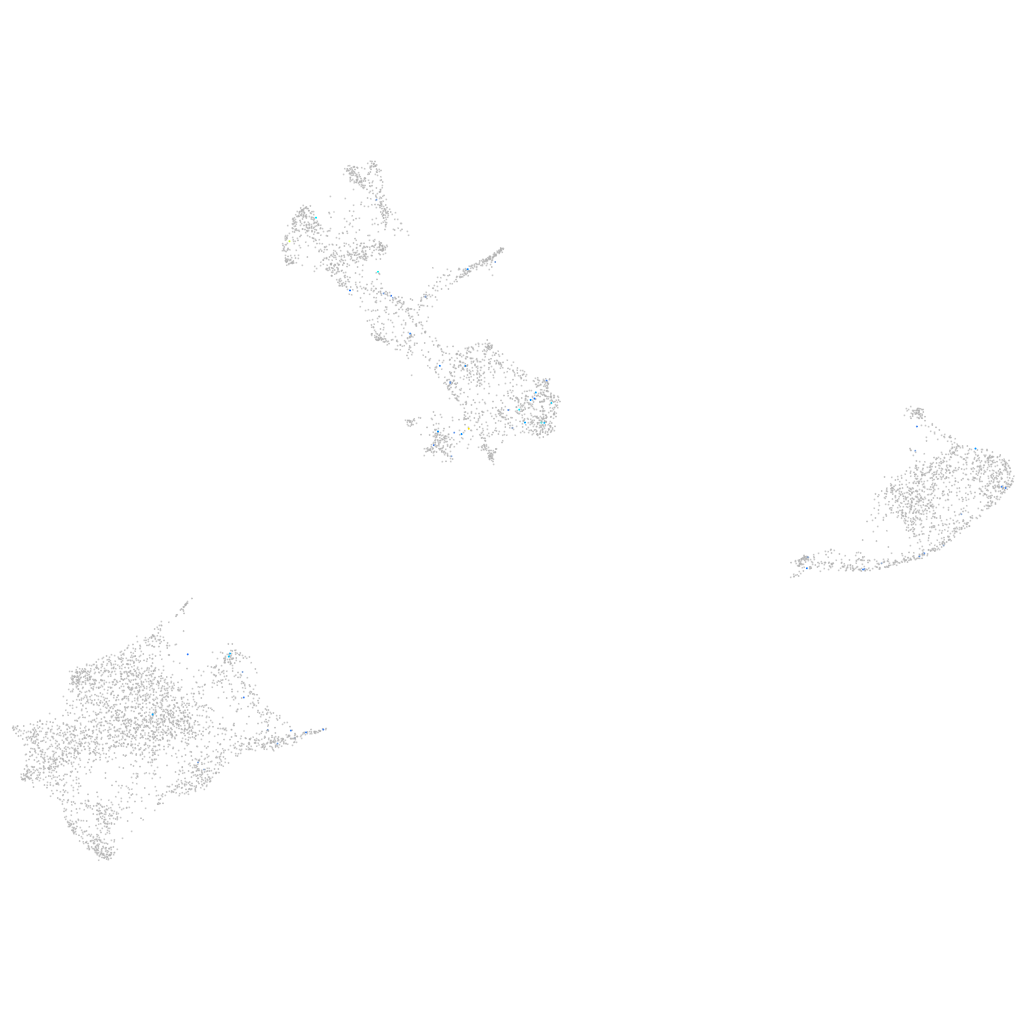
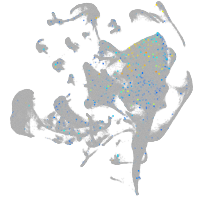
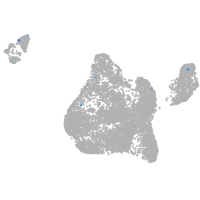
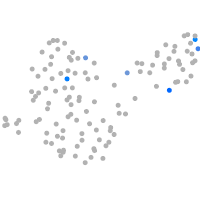
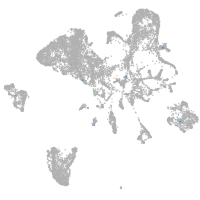
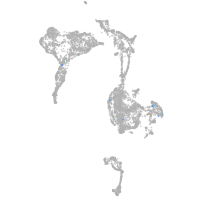
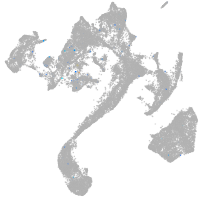
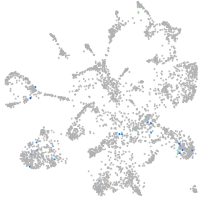
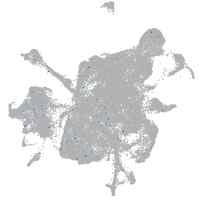
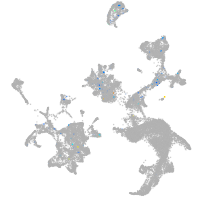
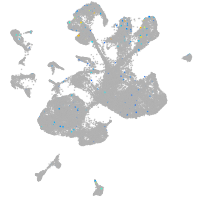
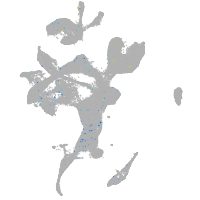
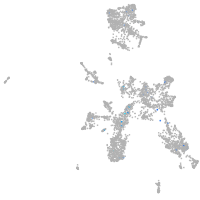
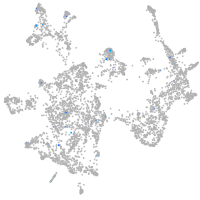
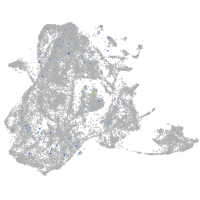
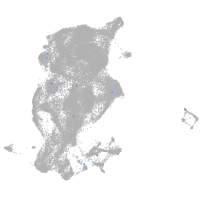
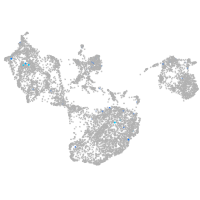
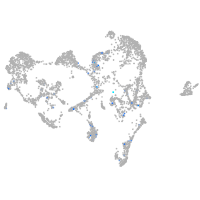
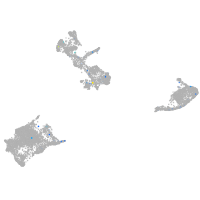
Gene expression UMAP
Display:
Expression
Stage
Other cell groups
all cells
blastomeres
PGCs
endoderm
axial mesoderm
muscle
mural cells /
non-skeletal muscle
mesenchyme
hematopoietic /
vasculature
pronephros
neural
spinal cord / glia
eye
taste / olfactory
otic / lateral line
epidermis
periderm
fin
ionocytes / mucous
pigment cells
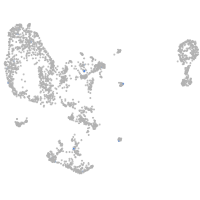
Expression by stage/cluster
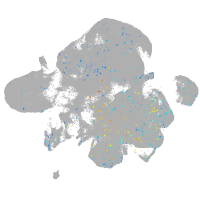
Correlated gene expression
Positive correlation
Negative correlation
Gene
r
Gene
r
ism2b
0.260
gstp1
-0.052
LOC101882231
0.252
CABZ01021592.1
-0.039
bcl3
0.249
uraha
-0.038
XLOC-043912
0.248
slc22a7a
-0.036
si:dkey-26i13.6
0.244
gch2
-0.035
CR774179.3
0.238
pvalb2
-0.032
vegfba
0.234
si:dkey-251i10.2
-0.032
XLOC-026497
0.231
krt8
-0.031
si:dkey-91i10.3
0.205
pts
-0.031
s1pr3a
0.200
zgc:110339
-0.030
si:dkeyp-101e12.1
0.194
actc1b
-0.029
tlr8b
0.191
paics
-0.029
ptafr
0.187
krt18b
-0.029
si:ch73-233f7.7
0.187
csrp2
-0.028
CR376857.1
0.186
TMEM19
-0.028
LOC110437744.1
0.184
mdh1aa
-0.027
CU467822.2
0.182
dio3a
-0.027
malrd1
0.181
akr1b1
-0.026
LOC103909513
0.175
si:ch211-251b21.1
-0.026
si:ch211-261n11.8
0.165
actb2
-0.026
pimr90
0.160
tmem130
-0.026
grk5
0.153
tnni2a.4
-0.025
gpr137ba
0.151
aox5
-0.025
LOC101883628
0.150
cyt1
-0.025
BX950187.1
0.148
pax7b
-0.025
LOC101884310
0.145
fbp1a
-0.025
kntc1
0.141
zgc:153031
-0.024
si:ch211-119e14.1
0.141
slc2a11b
-0.024
CABZ01075521.1
0.139
agmo
-0.024
LOC108180013
0.138
si:ch73-366l1.5
-0.024
GARNL3
0.137
krt4
-0.024
CR848705.1
0.135
si:dkey-73n8.3
-0.022
BX005085.7
0.134
ttn.1
-0.022
ccdc3b
0.134
prdx5
-0.022
LOC101885894
0.129
rbpms2a
-0.022