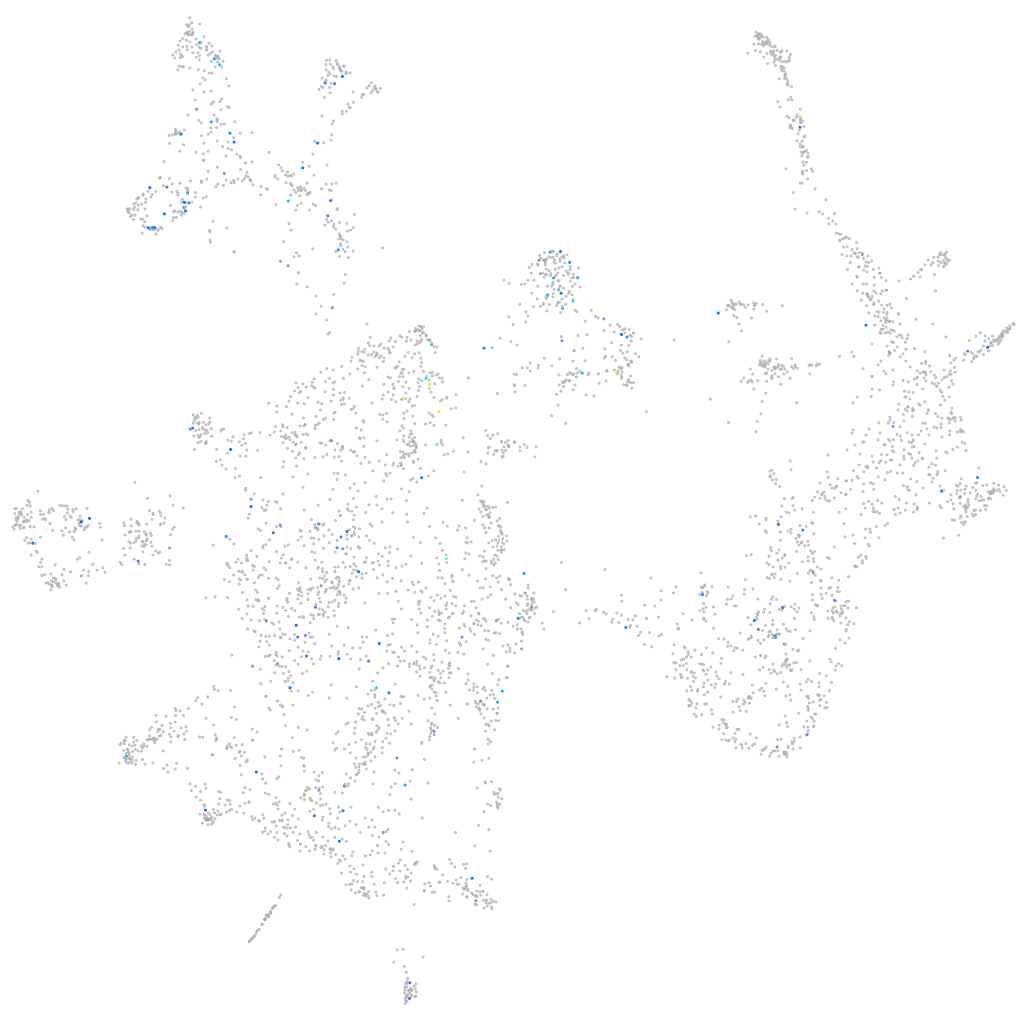
Daniocell
rgs7a (otic / lateral line)
regulator of G protein signaling 7a
ZFIN
Gene expression UMAP
Display:
Expression
Stage
Other cell groups
all cells
blastomeres
PGCs
endoderm
axial mesoderm
muscle
mural cells /
non-skeletal muscle
mesenchyme
hematopoietic /
vasculature
pronephros
neural
spinal cord / glia
eye
taste / olfactory
otic / lateral line
epidermis
periderm
fin
ionocytes / mucous
pigment cells
Expression by stage/cluster
Correlated gene expression
Positive correlation
Negative correlation
Gene
r
Gene
r
si:ch211-191a16.5
0.229
rpl39
-0.064
kel
0.189
rps15
-0.057
FO704822.1
0.181
ak2
-0.054
bscl2l
0.176
kdelr2a
-0.053
synpo2b
0.174
ier2a
-0.052
slc30a8
0.169
rps12
-0.051
si:dkey-246j6.1
0.164
rps9
-0.050
tgm2a
0.163
rpl18
-0.049
LOC108183612
0.163
rpl10a
-0.049
aox5
0.158
rpl24
-0.047
tmem266
0.155
abracl
-0.047
LOC100330797
0.154
krt15
-0.047
XLOC-002640
0.149
rpl18a
-0.046
gpr143
0.145
pdia5
-0.046
LOC101885188
0.142
cavin2b
-0.046
AL929396.1
0.139
KCTD15
-0.046
AL953875.1
0.139
rpl22
-0.045
si:dkey-21p1.3
0.139
gpx1a
-0.045
rgs9bp
0.136
anxa4
-0.045
si:ch211-276a17.5
0.134
dnase1l4.1
-0.044
CU633857.1
0.132
rpl35a
-0.044
LOC101883343
0.131
slc39a7
-0.044
LOC108180199
0.130
rps11
-0.044
rnasel3
0.129
col17a1b
-0.044
si:dkeyp-9d4.3
0.129
rps2
-0.044
si:dkey-165o8.2
0.129
myh9a
-0.044
cox4i2
0.129
ints1
-0.043
hapln4
0.126
rpl38
-0.043
fhl5
0.126
epcam
-0.043
LOC100535061
0.126
spcs3
-0.043
XLOC-001767
0.126
rps27a
-0.042
LOC110439864
0.126
rpl30
-0.042
creld1a
0.125
XLOC-044191
-0.042
foxb1b
0.123
cldnb
-0.042
hoxd12a
0.123
si:ch211-105j21.9
-0.042