Daniocell
rfx5 (mural cells / non-skeletal muscle)
"regulatory factor X, 5"
ZFIN
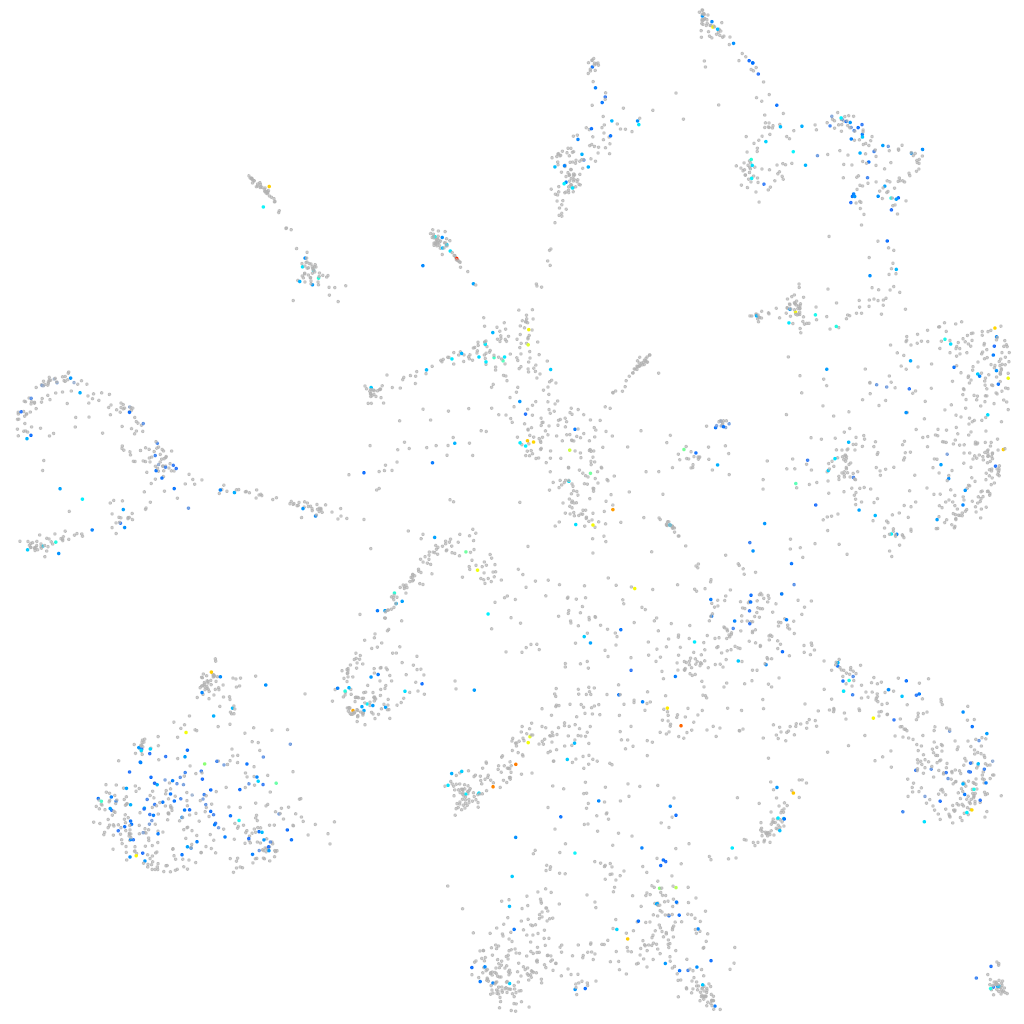
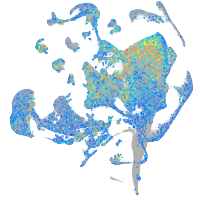
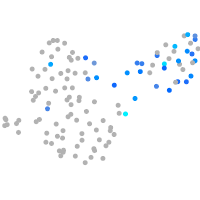
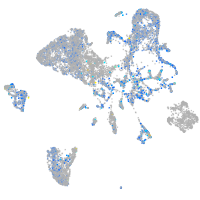
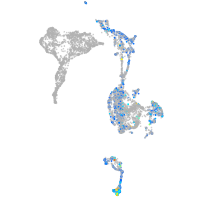
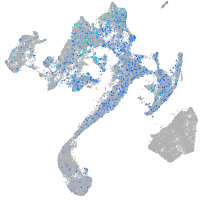
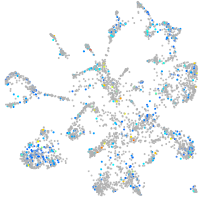
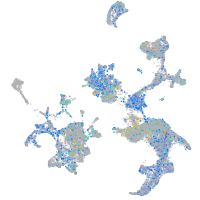
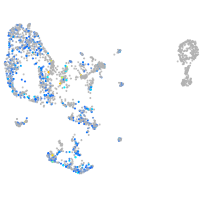
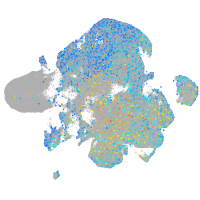
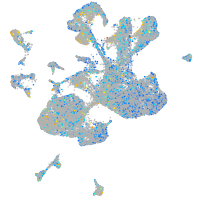
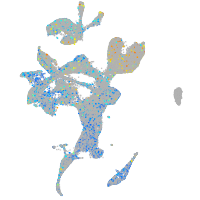
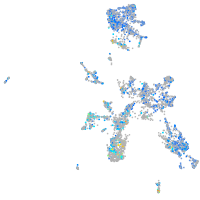
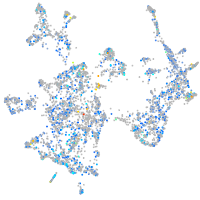
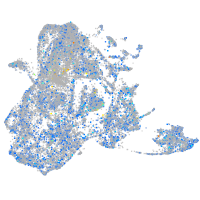
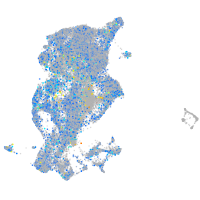
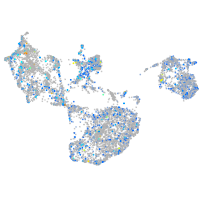
Gene expression UMAP
Display:
Expression
Stage
Other cell groups
all cells
blastomeres
PGCs
endoderm
axial mesoderm
muscle
mural cells /
non-skeletal muscle
mesenchyme
hematopoietic /
vasculature
pronephros
neural
spinal cord / glia
eye
taste / olfactory
otic / lateral line
epidermis
periderm
fin
ionocytes / mucous
pigment cells
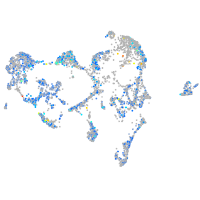
Expression by stage/cluster
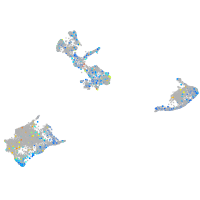
Correlated gene expression
Positive correlation
Negative correlation
Gene
r
Gene
r
si:ch211-208f21.2
0.131
XLOC-041870
-0.053
dtnbb
0.128
rgs2
-0.049
si:ch211-161h7.5
0.113
pvalb1
-0.047
crb3b
0.111
pdlim3a
-0.047
si:dkey-246j6.1
0.108
rbpms2a
-0.045
LOC101885027
0.106
pdlim3b
-0.045
hunk
0.106
myofl
-0.043
tmprss15
0.101
si:ch211-106k21.5
-0.042
XLOC-005294
0.100
si:dkey-33c14.3
-0.041
MPP4 (1 of many)
0.100
tinagl1
-0.039
cntn5
0.099
rgrb
-0.038
best1
0.099
lamb1b
-0.037
cyp17a2
0.099
adamts8a
-0.037
XLOC-007768
0.098
XLOC-025423
-0.037
ppp1r14c
0.097
si:dkey-151g10.6
-0.037
si:dkeyp-117b11.3
0.096
myl9a
-0.037
zgc:174917
0.096
tpm2
-0.037
armc2
0.095
apoa2
-0.036
mfsd2b
0.095
akap7
-0.036
BX323559.2
0.095
cnn1b
-0.036
CR847898.4
0.094
rho
-0.036
XLOC-043762
0.093
desmb
-0.034
LOC108179225
0.093
oprm1
-0.034
si:dkeyp-44b5.4
0.093
BX322618.1
-0.034
atp10b
0.093
gtf3c3
-0.034
rgra
0.092
epas1a
-0.034
pcsk1nl
0.092
LOC110440195
-0.034
snap25a
0.092
plekhg5a
-0.033
galn
0.092
CABZ01088274.1
-0.033
CR387996.1
0.091
cyp2p6
-0.033
LOC108181495
0.091
aspg
-0.033
gpc5b
0.091
cald1b
-0.033
ywhag2
0.091
smyhc1
-0.033
gpr182
0.090
admb
-0.033
XLOC-012926
0.090
BX323087.1
-0.033