Daniocell
rem1 (blastomeres)
RAS (RAD and GEM)-like GTP-binding 1
ZFIN
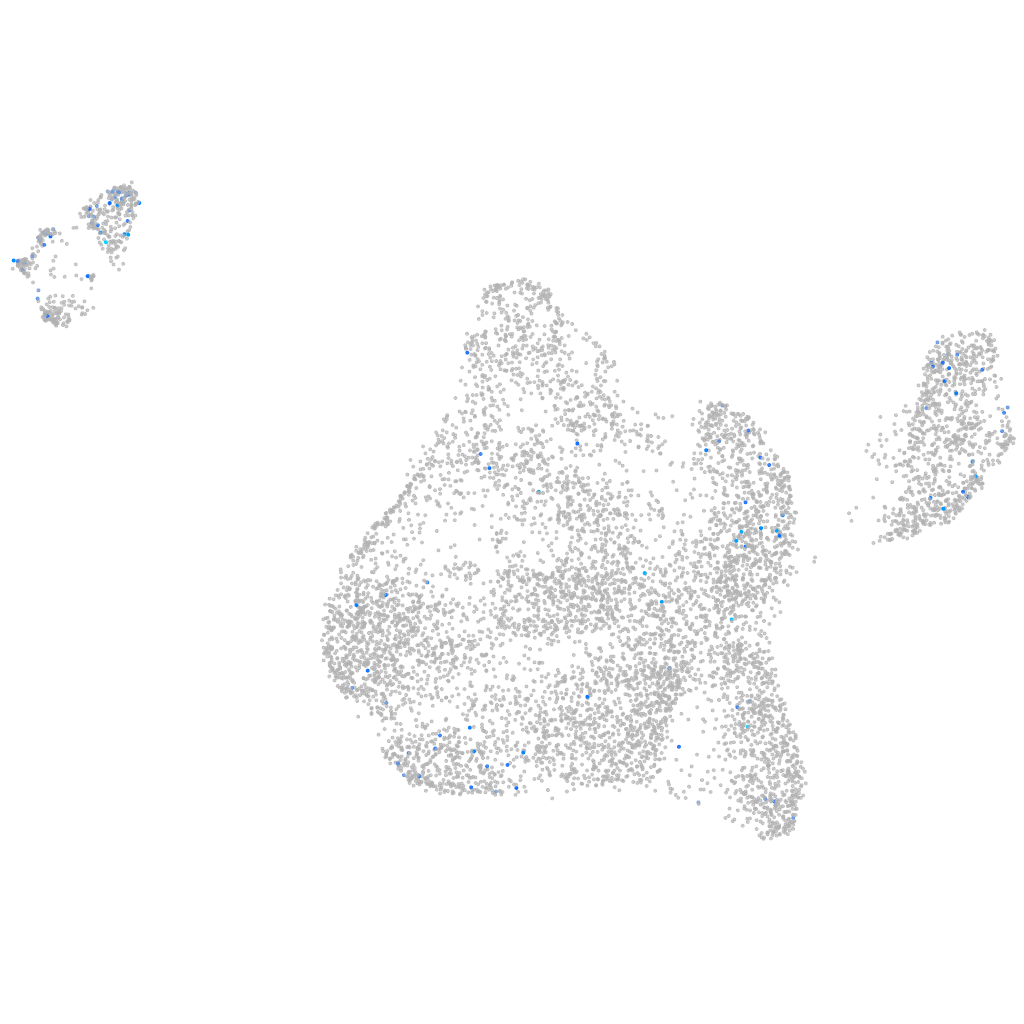
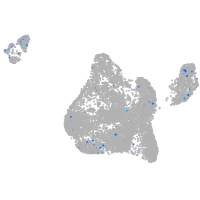
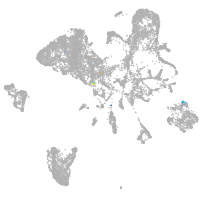
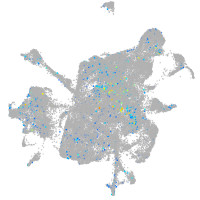
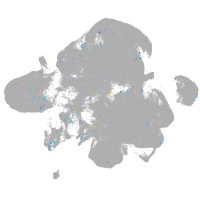
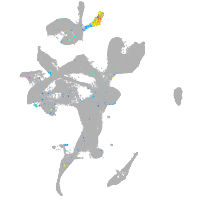
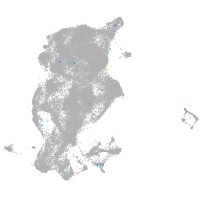
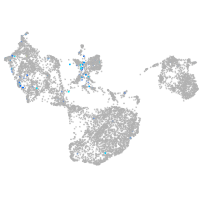
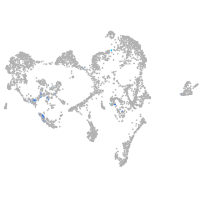
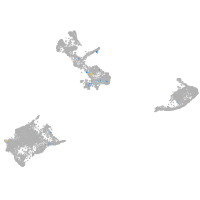
Gene expression UMAP
Display:
Expression
Stage
Other cell groups
all cells
blastomeres
PGCs
endoderm
axial mesoderm
muscle
mural cells /
non-skeletal muscle
mesenchyme
hematopoietic /
vasculature
pronephros
neural
spinal cord / glia
eye
taste / olfactory
otic / lateral line
epidermis
periderm
fin
ionocytes / mucous
pigment cells
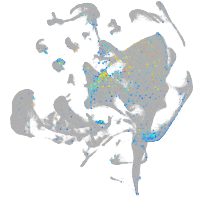
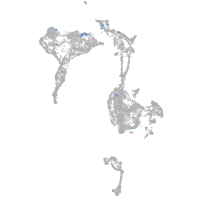
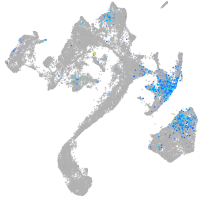
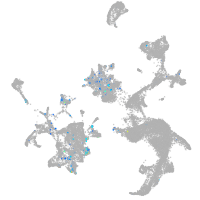
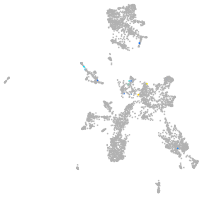
Expression by stage/cluster
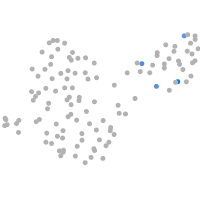
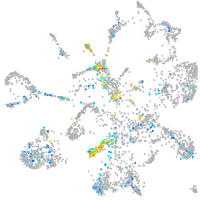
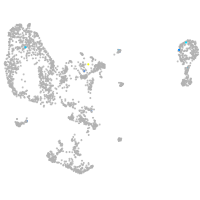
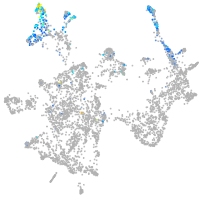
Correlated gene expression
Positive correlation
Negative correlation
Gene
r
Gene
r
si:dkey-193c22.1
0.152
hspb1
-0.138
LOC110438247
0.150
marcksl1b
-0.136
CU104743.1
0.137
eef1a1l1
-0.133
h2af1al
0.132
si:ch73-1a9.3
-0.126
CU929307.1
0.131
stm
-0.123
zgc:113424
0.128
hnrnpa0b
-0.121
zgc:111983
0.127
hmga1a
-0.117
her4.3
0.126
si:ch211-152c2.3
-0.113
ccdc186
0.126
ptmab
-0.110
slmapb
0.123
si:ch211-222l21.1
-0.107
ska2
0.120
si:dkey-56m19.5
-0.104
tcnbb
0.120
hmgb2a
-0.104
her5
0.119
polr3gla
-0.103
slc25a25a
0.117
khdrbs1a
-0.098
eloal
0.117
si:dkey-151g10.6
-0.097
ccr10
0.117
hnrnpa1b
-0.096
cldnd
0.115
dynll1
-0.096
cldng
0.114
rplp1
-0.095
acp5a
0.114
rps12
-0.095
hsf4
0.113
ybx1
-0.094
XLOC-014486
0.113
hmgn6
-0.093
spink2.1
0.113
aldob
-0.093
LOC108179136
0.112
rpl36
-0.092
si:dkey-208k4.2
0.112
rps4x
-0.090
si:ch211-132b12.8
0.111
rpl7a
-0.089
osbpl7
0.110
rps15a
-0.088
lsm14b
0.110
cirbpb
-0.088
mknk2a
0.110
rplp0
-0.082
btg4
0.109
rpl39
-0.082
pik3r3b
0.109
anp32e
-0.081
rab11al
0.108
rpl32
-0.081
rflnb
0.108
hmgb2b
-0.080
XLOC-012410
0.107
si:ch1073-80i24.3
-0.080
LOC110438029
0.105
rpl30
-0.080
ell
0.105
rpl26
-0.080