Daniocell
rad51d (pronephros)
RAD51 paralog D
ZFIN
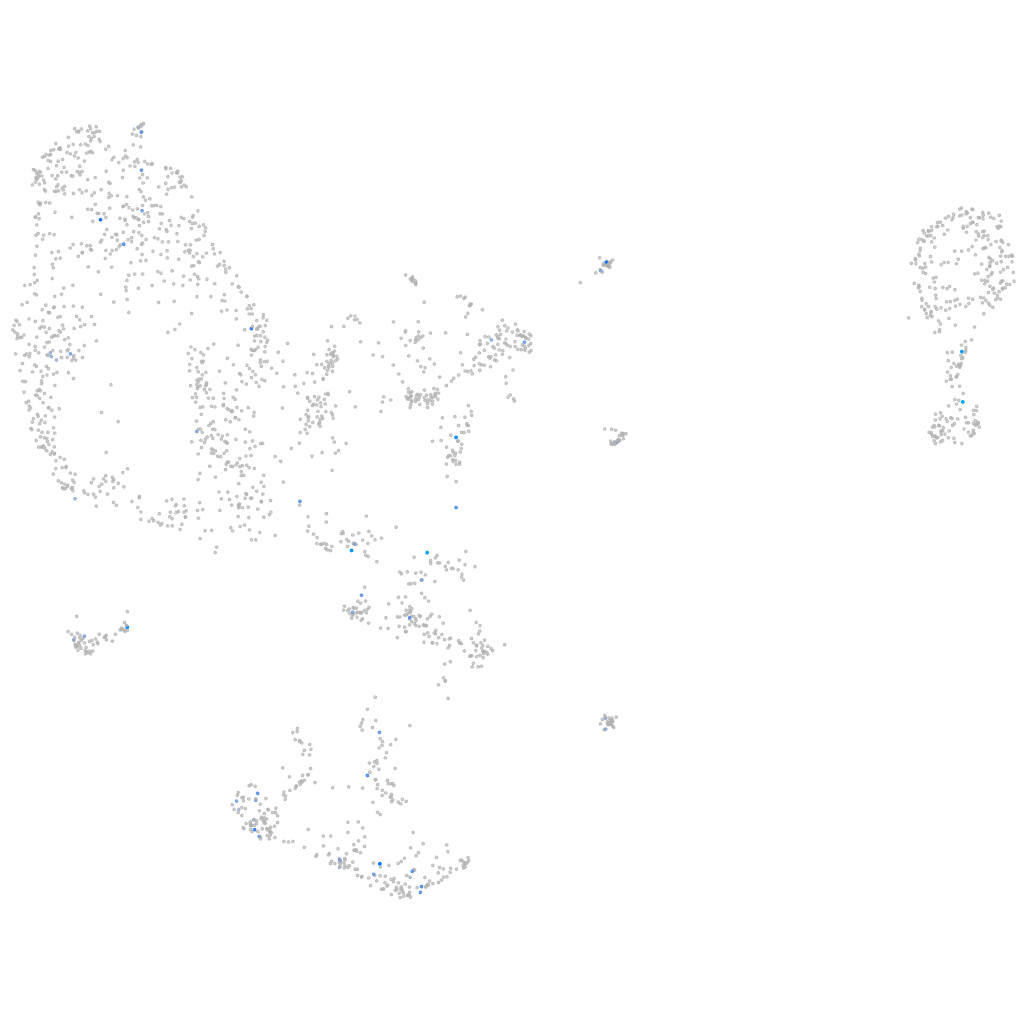
Gene expression UMAP
Display:
Expression
Stage
Other cell groups
all cells
blastomeres
PGCs
endoderm
axial mesoderm
muscle
mural cells /
non-skeletal muscle
mesenchyme
hematopoietic /
vasculature
pronephros
neural
spinal cord / glia
eye
taste / olfactory
otic / lateral line
epidermis
periderm
fin
ionocytes / mucous
pigment cells
Expression by stage/cluster
Correlated gene expression
Positive correlation
Negative correlation
Gene
r
Gene
r
AL935292.1
0.288
aldob
-0.057
LOC103909209
0.280
fbp1b
-0.057
XLOC-005179
0.280
gamt
-0.055
fmn1
0.276
grhprb
-0.051
CR394556.1
0.276
ftcd
-0.051
RF00429
0.275
dab2
-0.049
BX908804.3
0.275
slc26a1
-0.049
BX901883.4
0.275
pklr
-0.048
BX908780.1
0.275
pdzk1ip1
-0.047
BX908804.1
0.275
cyp2y3
-0.047
LOC110437896
0.268
fam84a
-0.046
BX649388.3
0.265
si:ch211-168b3.2
-0.046
GPR151
0.253
nit2
-0.046
tpbgl
0.242
csad
-0.046
atoh1c
0.241
si:dkey-33i11.9
-0.046
CT027744.1
0.239
bhmt
-0.046
si:dkeyp-13d11.2
0.239
smim1
-0.045
BX465844.1
0.223
pbld
-0.045
LOC100334401
0.217
slc26a6
-0.045
stil
0.209
pnp6
-0.044
LOC110439299
0.207
si:dkey-194e6.1
-0.044
si:ch211-131k2.2
0.199
cdh11
-0.044
XLOC-035750
0.198
muc13b
-0.044
XLOC-044324
0.192
agxta
-0.044
BX004980.1
0.187
sult1st4
-0.044
or128-10
0.187
cth
-0.043
fam129ab
0.182
zgc:92040
-0.043
rem1
0.181
zgc:136493
-0.043
CT997819.2
0.180
etnppl
-0.043
LOC110437967
0.178
hao1
-0.043
slc38a8a
0.177
slc23a1
-0.043
cep78
0.176
gpt2l
-0.042
dut
0.176
haao
-0.042
lck
0.175
gstt1a
-0.042
LOC100329307
0.175
acy3.2
-0.042