Daniocell
rad51d (ionocytes / mucous-producing)
RAD51 paralog D
ZFIN
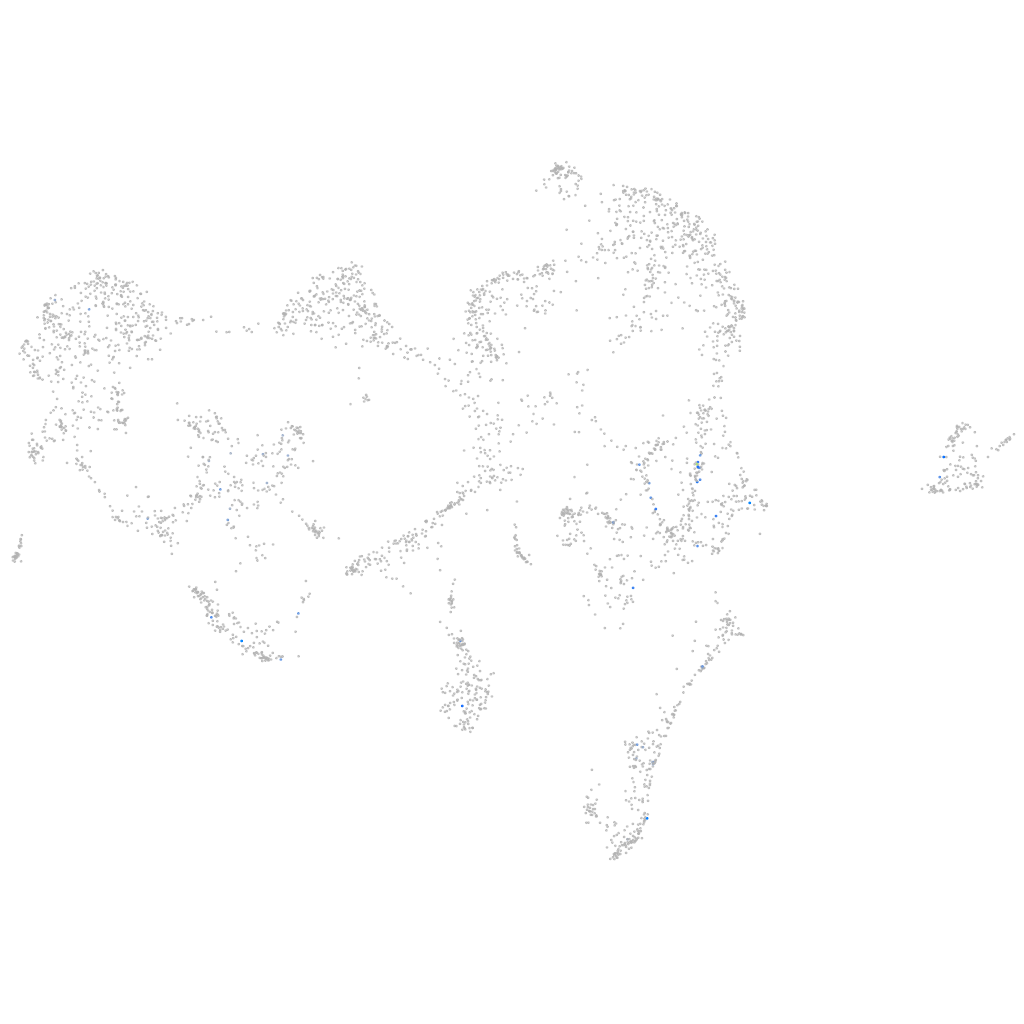
Gene expression UMAP
Display:
Expression
Stage
Other cell groups
all cells
blastomeres
PGCs
endoderm
axial mesoderm
muscle
mural cells /
non-skeletal muscle
mesenchyme
hematopoietic /
vasculature
pronephros
neural
spinal cord / glia
eye
taste / olfactory
otic / lateral line
epidermis
periderm
fin
ionocytes / mucous
pigment cells
Expression by stage/cluster
Correlated gene expression
Positive correlation
Negative correlation
Gene
r
Gene
r
c3a.5
0.516
zgc:153284
-0.065
hydin
0.368
si:dkey-193p11.2
-0.056
b3galt1b
0.360
zgc:110333
-0.055
XLOC-004408
0.323
si:dkey-248g15.3
-0.052
HIST2H3A
0.314
slc25a5
-0.049
si:ch73-368j24.10
0.280
bloc1s6
-0.049
rbm24b
0.278
ak1
-0.046
lim2.5
0.242
soul2
-0.046
bora
0.240
icn2
-0.046
CR936974.1
0.230
si:ch211-195b11.3
-0.045
LOC110439995
0.230
chmp1b
-0.044
si:dkey-108k21.24
0.229
stat1a
-0.043
si:ch73-368j24.9
0.225
si:dkey-184p9.7
-0.043
CU457819.1
0.216
itm2bb
-0.043
kbtbd7
0.216
ccni
-0.041
hist1h2a2
0.211
b2ml
-0.041
cabz01093075.1
0.210
atp1a1a.2
-0.041
ugt2b3
0.198
selenow1
-0.040
LOC108184019
0.198
si:ch73-31d8.2
-0.040
e2f8
0.198
atp1b1b
-0.040
pip4p2
0.196
rnf128a
-0.040
zgc:113984.1
0.195
rgs5b
-0.039
LOC101882668
0.190
si:ch73-359m17.9
-0.039
si:ch211-113a14.18
0.190
echdc2
-0.039
CR792424.1
0.180
litaf
-0.039
si:dkeyp-27e10.3
0.179
si:dkey-247k7.2
-0.039
XLOC-028703
0.178
selenow2b
-0.039
si:ch211-266i6.3
0.178
mgst1.2
-0.039
si:ch1073-159d7.6
0.175
si:zfos-943e10.1
-0.038
phkg1a
0.173
atp1a1a.3
-0.038
zgc:110425
0.172
si:ch211-79k12.1
-0.038
fanci
0.172
krt91
-0.038
si:dkey-108k21.10
0.167
abcb5
-0.037
CABZ01110379.1
0.164
epdl1
-0.037
CR376741.2
0.164
trim35-12
-0.037