Daniocell
qser1 (otic / lateral line)
glutamine and serine rich 1
ZFIN
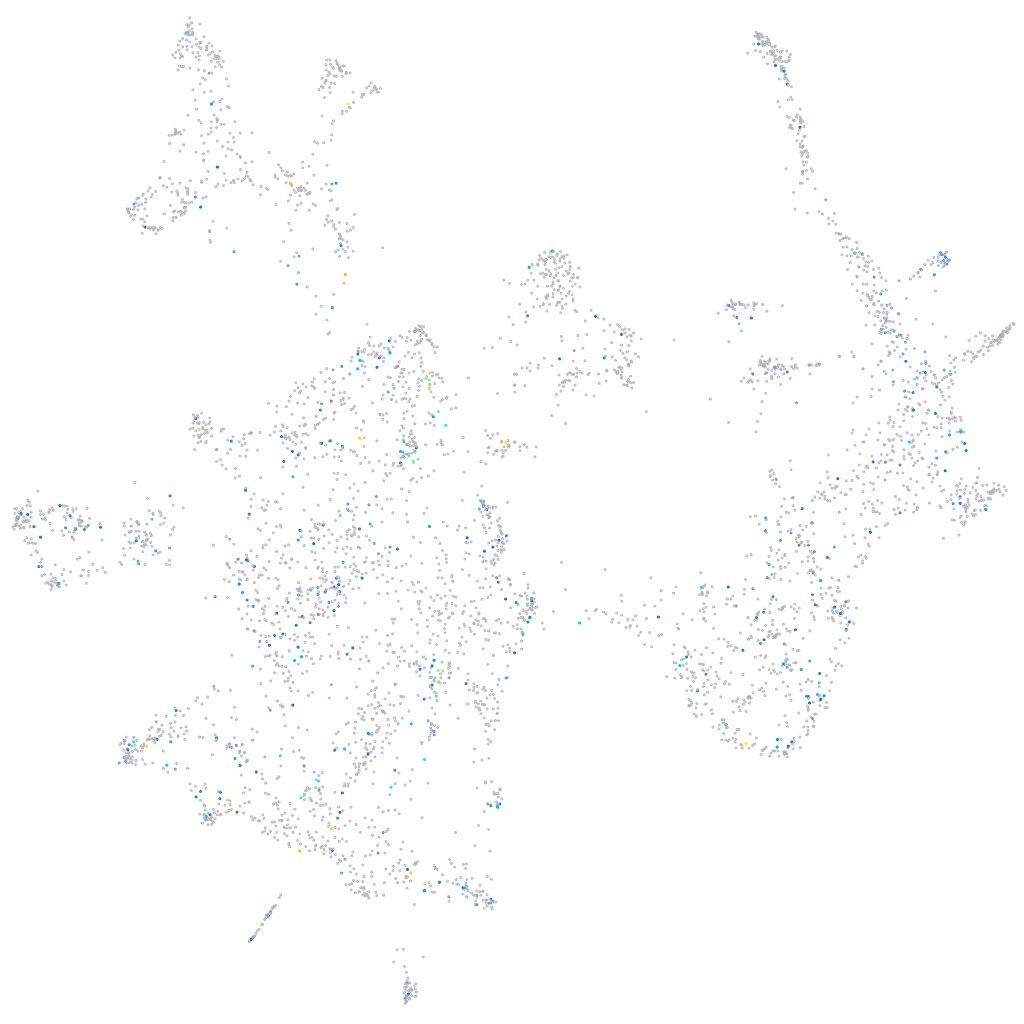
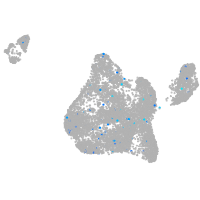
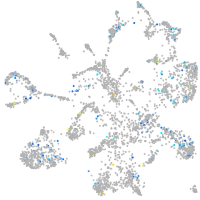
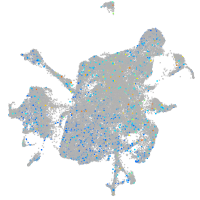
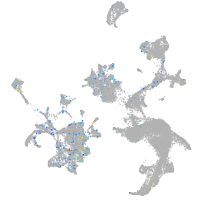
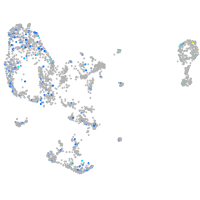
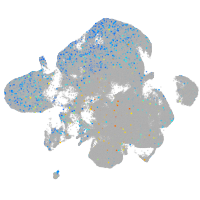
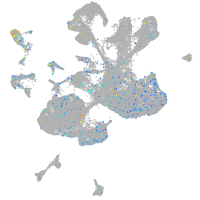
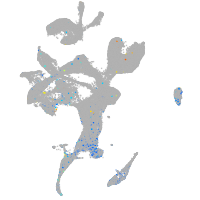
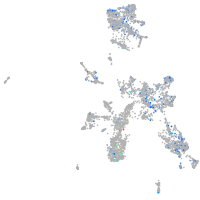
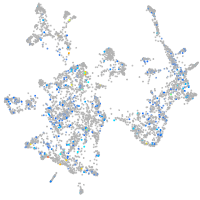
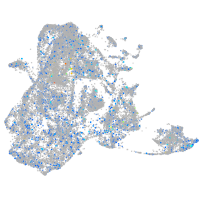
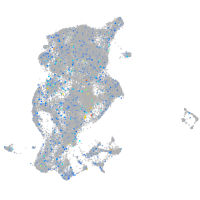
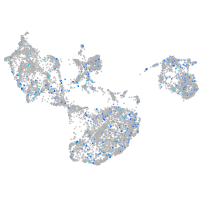
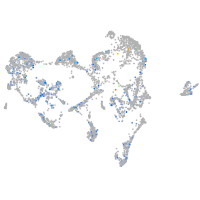
Gene expression UMAP
Display:
Expression
Stage
Other cell groups
all cells
blastomeres
PGCs
endoderm
axial mesoderm
muscle
mural cells /
non-skeletal muscle
mesenchyme
hematopoietic /
vasculature
pronephros
neural
spinal cord / glia
eye
taste / olfactory
otic / lateral line
epidermis
periderm
fin
ionocytes / mucous
pigment cells
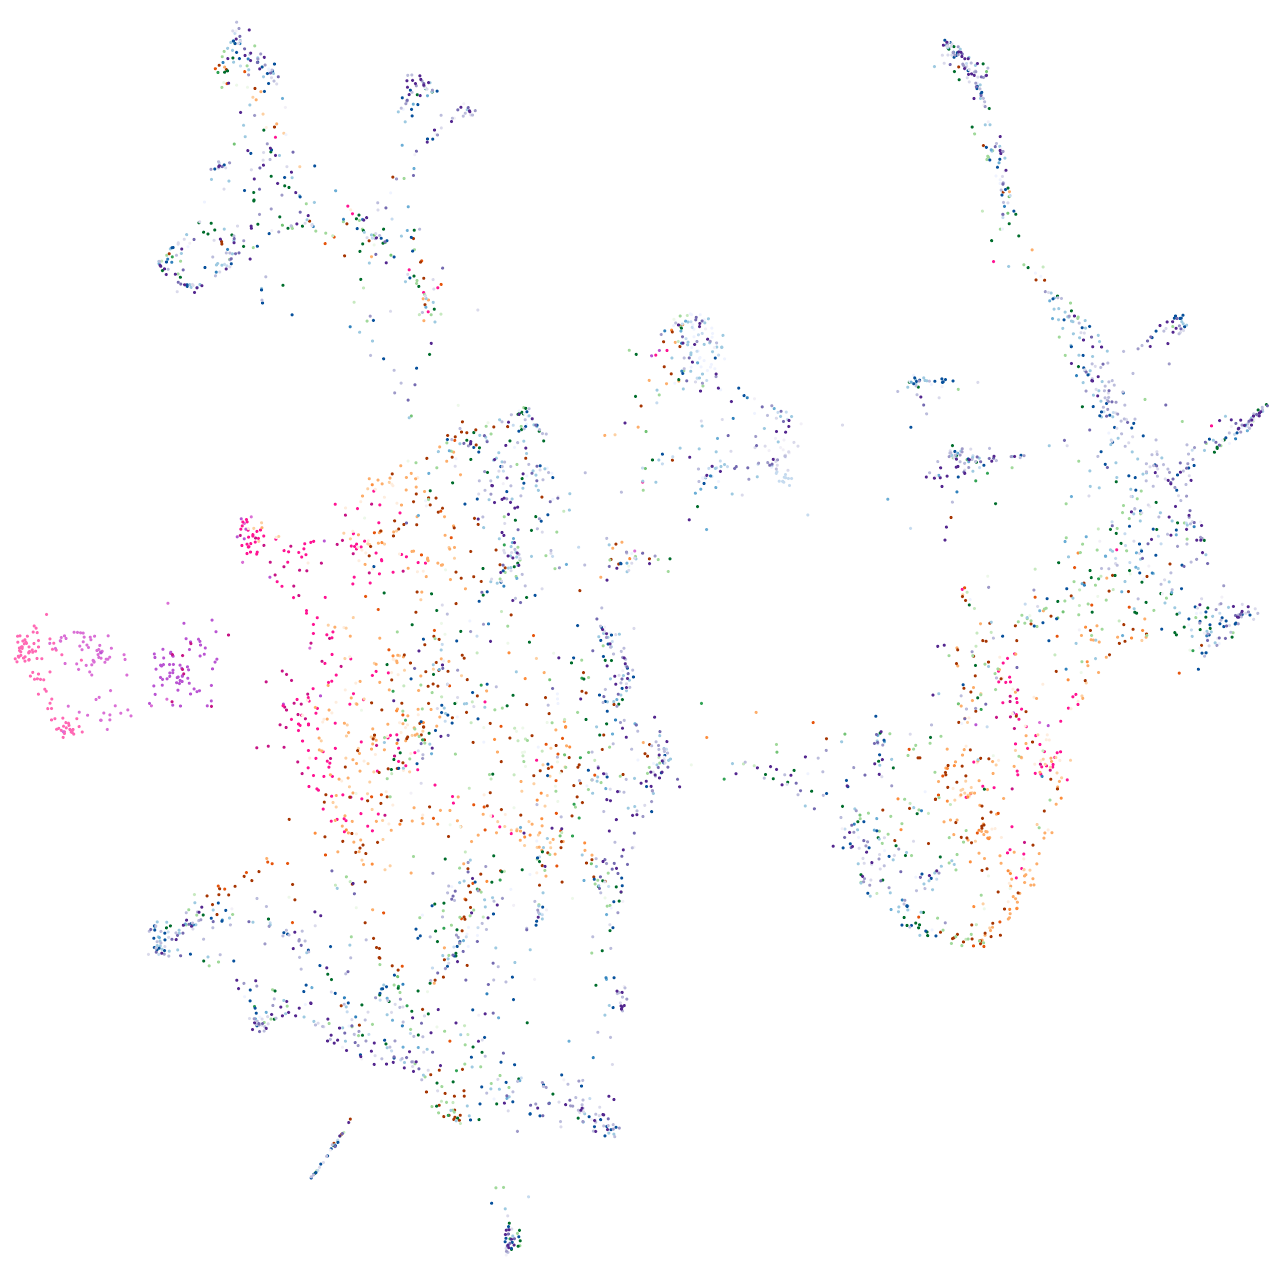
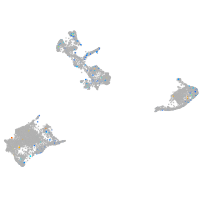
Expression by stage/cluster
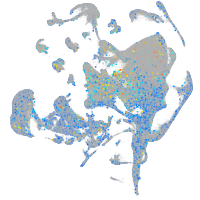
Correlated gene expression
Positive correlation
Negative correlation
Gene
r
Gene
r
LOC100005640
0.203
COX5B
-0.064
plpp4
0.177
atp1a3b
-0.063
cacng6b
0.155
LOC100001178
-0.062
stum
0.144
CR925719.1
-0.061
XLOC-036507
0.142
hsd17b7
-0.061
BX248238.1
0.132
cd164l2
-0.060
zgc:123107
0.130
pvalb8
-0.060
si:ch211-209a2.2
0.129
pcsk5a
-0.059
si:dkeyp-9d4.3
0.125
calm3b
-0.058
XLOC-001298
0.121
apba1a
-0.057
si:ch211-234p6.9
0.119
tmbim1b
-0.057
zmp:0000000984
0.116
sncb
-0.057
map6d1
0.114
tspan13b
-0.057
RF01296
0.114
osbpl1a
-0.057
XLOC-021140
0.114
atp6v0cb
-0.056
tgfb2
0.111
pou4f1
-0.056
CU466278.1
0.109
syt14b
-0.056
LOC101885086
0.107
si:dkey-280e21.3
-0.056
slc35f3b
0.105
prr15la
-0.056
cd81a
0.103
s100t
-0.056
ror1
0.103
slc17a8
-0.056
XLOC-002640
0.103
gpx1b
-0.056
XLOC-024261
0.103
baiap2l2b
-0.056
LOC103911494
0.102
tescb
-0.055
mfsd2b
0.101
gipc3
-0.055
SH2D3A
0.099
emb
-0.055
znf1052
0.099
otofb
-0.055
rprm3
0.097
nptna
-0.055
XLOC-004878
0.096
si:dkey-11c5.11
-0.055
il17d
0.095
dpysl3
-0.055
wfdc1
0.094
stard15
-0.054
XLOC-012418
0.093
gpx2
-0.054
cd9b
0.092
ptprq
-0.054
cyth4b
0.091
kifl
-0.054
sdc4
0.091
calml4a
-0.054