Daniocell
pygb (taste / olfactory)
"phosphorylase, glycogen%3B brain"
ZFIN
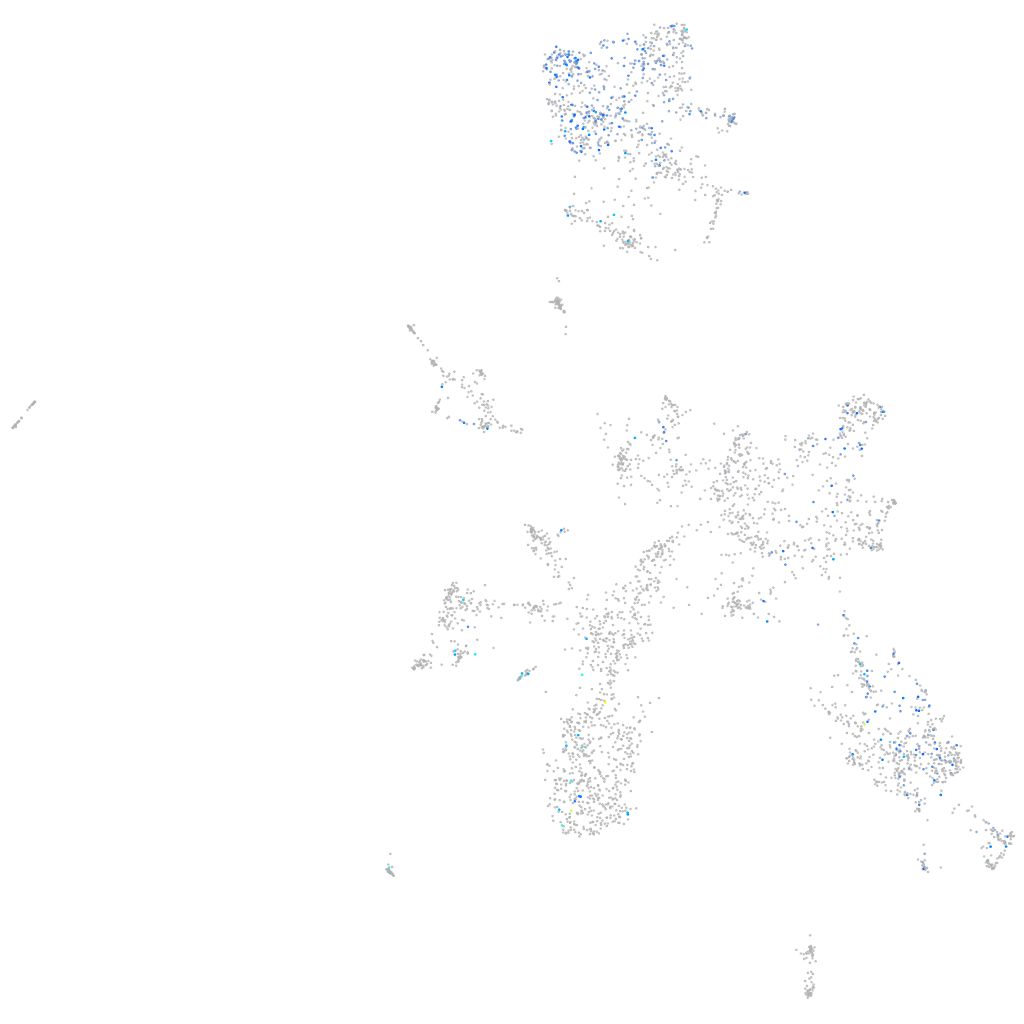
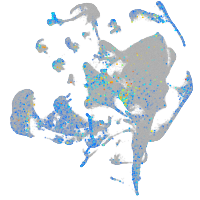
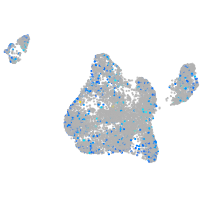
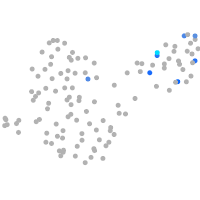
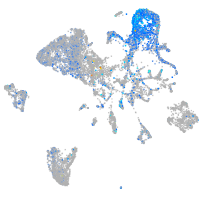
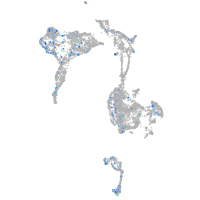
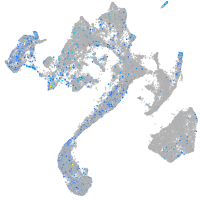
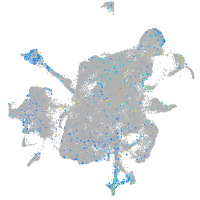
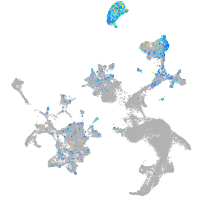
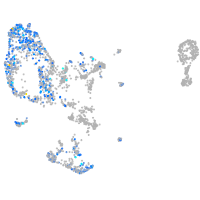
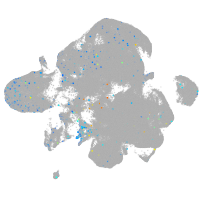
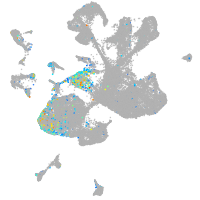
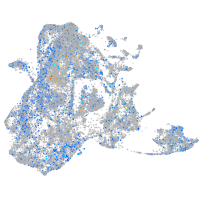
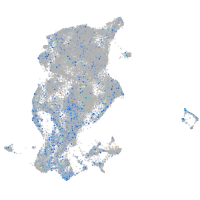
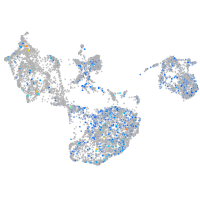
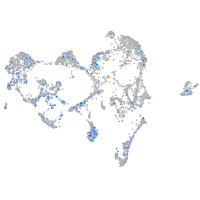
Gene expression UMAP
Display:
Expression
Stage
Other cell groups
all cells
blastomeres
PGCs
endoderm
axial mesoderm
muscle
mural cells /
non-skeletal muscle
mesenchyme
hematopoietic /
vasculature
pronephros
neural
spinal cord / glia
eye
taste / olfactory
otic / lateral line
epidermis
periderm
fin
ionocytes / mucous
pigment cells
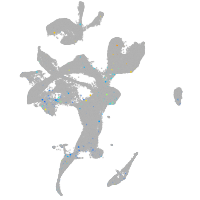
Expression by stage/cluster
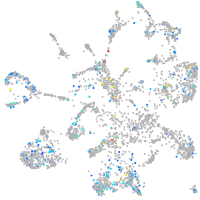
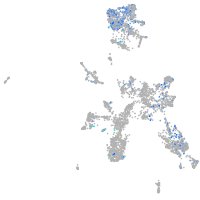
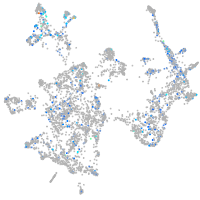
Correlated gene expression
Positive correlation
Negative correlation
Gene
r
Gene
r
scinlb
0.258
elavl3
-0.145
CR318588.3
0.247
NC-002333.4
-0.119
si:ch73-347e22.8
0.239
stmn1b
-0.117
zgc:165423
0.239
insm1a
-0.117
anxa4
0.239
sox11a
-0.114
mvp
0.236
si:dkey-56m19.5
-0.114
cxcl14
0.236
tmeff1b
-0.112
vill
0.235
tmsb
-0.102
atp2a3
0.232
epb41a
-0.102
gnb3a
0.232
myt1a
-0.099
trpm5
0.232
LOC100537342
-0.098
si:dkey-248g15.3
0.232
tp53inp2
-0.098
ceacam1
0.229
uncx
-0.097
rgs1
0.228
bcl11ba
-0.096
itpkb
0.228
si:ch211-222l21.1
-0.094
rassf6
0.226
cxcr4b
-0.093
si:dkeyp-80c12.5
0.225
rtn1a
-0.093
si:cabz01007794.1
0.225
si:dkey-276j7.1
-0.092
hopx
0.225
sox11b
-0.092
si:dkeyp-71f10.5
0.225
ebf3a
-0.091
si:ch73-199e17.1
0.221
nova2
-0.090
crip1
0.221
CU467822.1
-0.089
LOC100536671
0.221
elavl4
-0.088
grtp1a
0.220
ebf2
-0.087
gng13a
0.220
dpysl2b
-0.085
clic5b
0.219
tuba1a
-0.085
itpr3
0.219
gnao1a
-0.084
si:ch211-195b11.3
0.218
neurod1
-0.084
ARF5 (1 of many)
0.216
cd99l2
-0.082
myl9a
0.214
neurod4
-0.082
abca12
0.214
ppfia3
-0.082
zgc:101744
0.213
apex1
-0.081
avil
0.213
sncb
-0.080
ponzr6
0.213
lhx2a
-0.080
si:dkey-87o1.2
0.213
zc4h2
-0.079