
"PWP1 homolog, endonuclein"
ZFIN 
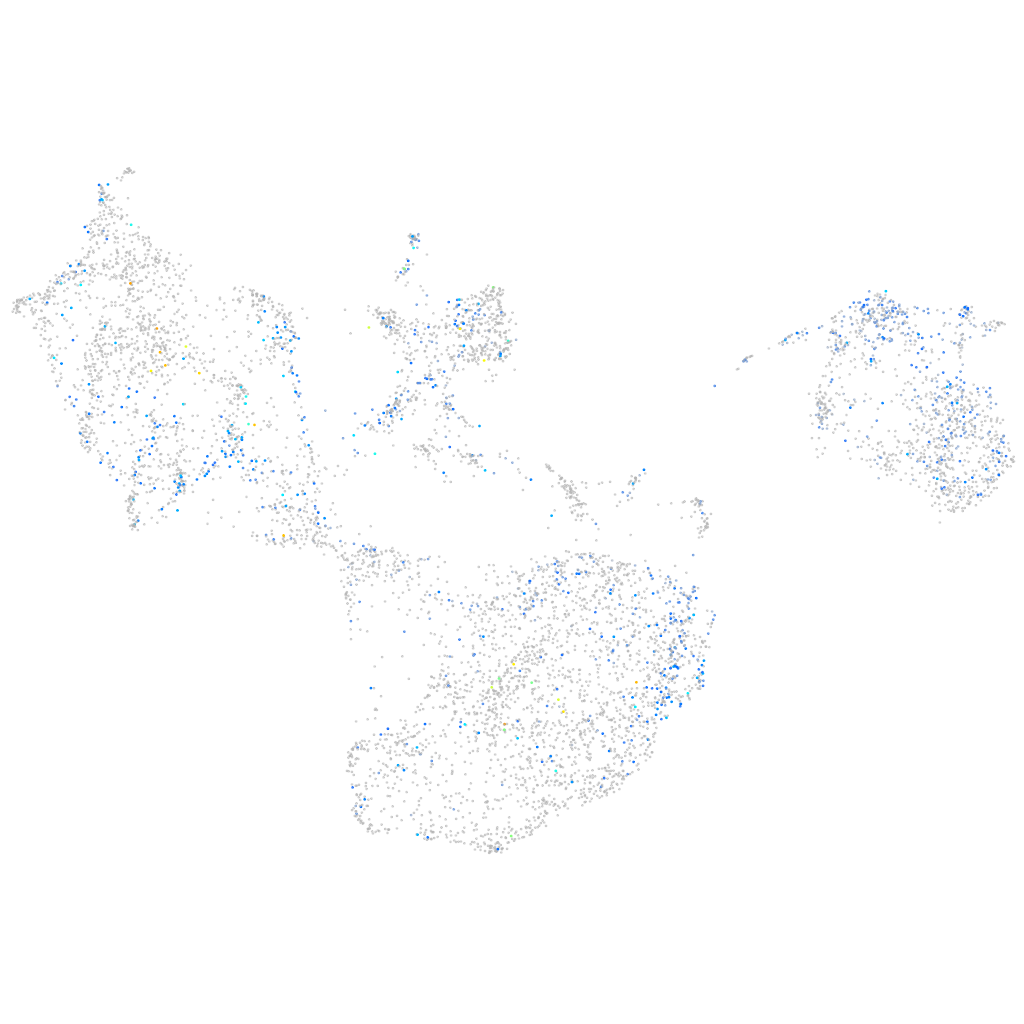
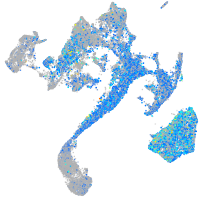
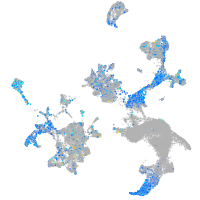
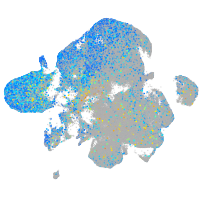
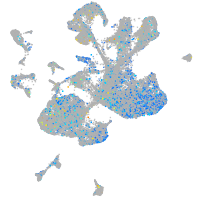
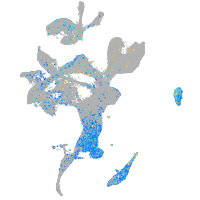
Gene expression UMAP


Expression by stage/cluster
Correlated gene expression
| Positive correlation | Negative correlation | ||
| Gene | r | Gene | r |
| npm1a | 0.209 | and2 | -0.104 |
| c1qbp | 0.182 | col1a1a | -0.093 |
| fbl | 0.177 | msx1b | -0.093 |
| snu13b | 0.170 | bambia | -0.087 |
| nop58 | 0.166 | ogna | -0.087 |
| nop10 | 0.162 | and1 | -0.086 |
| eif6 | 0.157 | sparc | -0.085 |
| mybbp1a | 0.153 | aqp3a | -0.084 |
| nop56 | 0.152 | frem2a | -0.083 |
| ncl | 0.148 | CABZ01074130.1 | -0.083 |
| hspe1 | 0.147 | dlx2a | -0.082 |
| rsl1d1 | 0.146 | sp9 | -0.080 |
| dkc1 | 0.145 | frem1a | -0.073 |
| si:ch211-217k17.7 | 0.144 | histh1l | -0.073 |
| prmt1 | 0.140 | fstl1a | -0.073 |
| nhp2 | 0.139 | nid1b | -0.071 |
| tomm20a | 0.137 | ppt1 | -0.070 |
| tsr2 | 0.136 | bambib | -0.070 |
| ddx21 | 0.136 | hapln3 | -0.070 |
| rrp1 | 0.135 | sp6 | -0.069 |
| cct7 | 0.135 | dlx2b | -0.069 |
| nop2 | 0.134 | bcam | -0.069 |
| mcm2 | 0.133 | fras1 | -0.068 |
| pa2g4a | 0.130 | si:ch211-243g18.2 | -0.068 |
| ptges3b | 0.130 | egfl6 | -0.067 |
| tcp1 | 0.129 | si:ch211-246m6.5 | -0.066 |
| mcm5 | 0.128 | vcana | -0.066 |
| cct3 | 0.128 | LOC101882251 | -0.066 |
| ranbp1 | 0.127 | fgf8a | -0.066 |
| pa2g4b | 0.127 | mdka | -0.066 |
| ran | 0.126 | sema3e | -0.066 |
| tomm6 | 0.125 | cap1 | -0.064 |
| grwd1 | 0.124 | BX663503.3 | -0.064 |
| LOC103911035 | 0.124 | tmsb4x | -0.063 |
| ddx18 | 0.123 | thy1 | -0.063 |