Daniocell
psmb10 (pigment cells)
proteasome 20S subunit beta 10
ZFIN
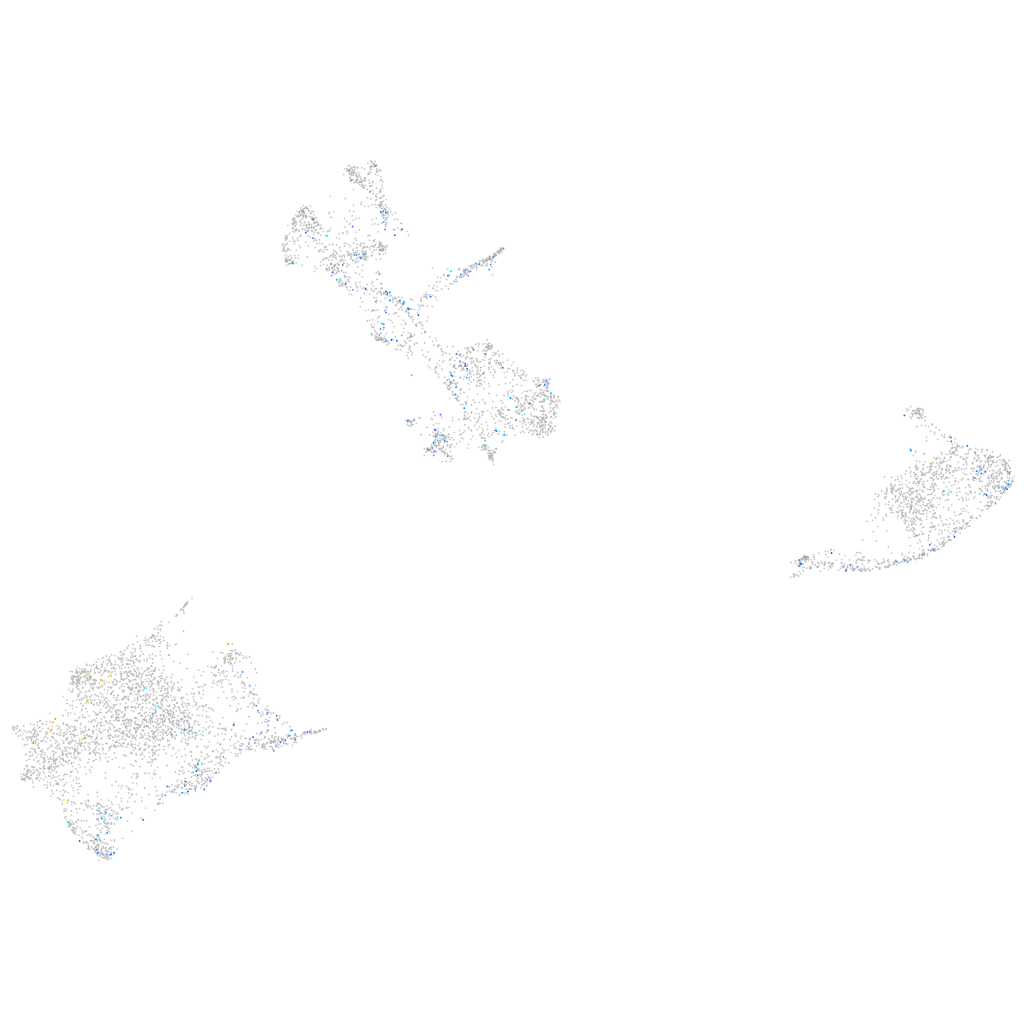
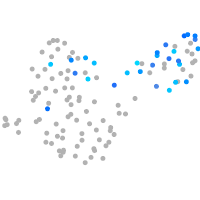
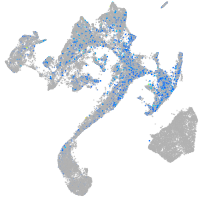
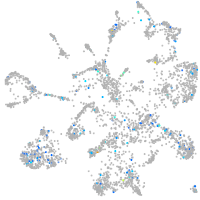
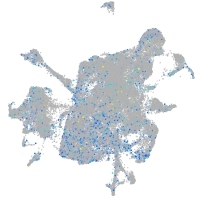
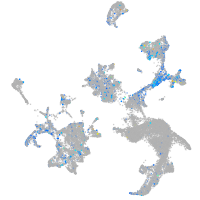
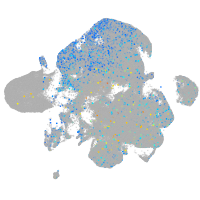
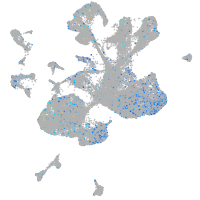
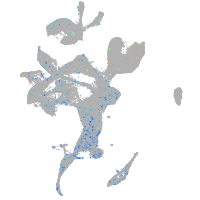
Gene expression UMAP
Display:
Expression
Stage
Other cell groups
all cells
blastomeres
PGCs
endoderm
axial mesoderm
muscle
mural cells /
non-skeletal muscle
mesenchyme
hematopoietic /
vasculature
pronephros
neural
spinal cord / glia
eye
taste / olfactory
otic / lateral line
epidermis
periderm
fin
ionocytes / mucous
pigment cells
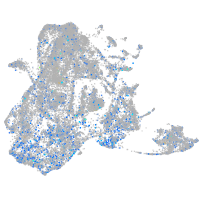
Expression by stage/cluster
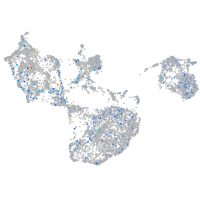
Correlated gene expression
Positive correlation
Negative correlation
Gene
r
Gene
r
adgre13
0.156
pts
-0.034
lyve1b
0.154
si:dkey-251i10.2
-0.034
rassf9
0.132
atp2a1
-0.033
XLOC-036929
0.121
gch2
-0.033
si:ch73-15n24.1
0.117
icn2
-0.033
zgc:195282
0.112
hbae1.1
-0.030
ms4a17a.17
0.109
tmem130
-0.030
tspearb
0.102
gstp1
-0.030
rhd
0.102
CABZ01021592.1
-0.029
XLOC-034488
0.101
zgc:153031
-0.029
lrrc53
0.099
actc1b
-0.028
CT573429.1
0.098
txn
-0.027
CR450833.1
0.097
cplx2
-0.027
synpo2b
0.096
cotl1
-0.027
cytip
0.095
rbp4l
-0.027
RF00056
0.094
uraha
-0.026
vimr1
0.094
zgc:110339
-0.026
c5
0.092
hbbe1.3
-0.025
syk
0.090
tcnbb
-0.025
zgc:112965
0.090
si:ch211-251b21.1
-0.025
zgc:92429
0.088
wu:fb18f06
-0.024
slc44a4
0.087
hbbe3
-0.024
BX085193.1
0.087
bscl2l
-0.024
si:ch211-151m7.6
0.086
ckmb
-0.024
zgc:194007
0.086
slc22a7a
-0.023
anpepb
0.085
hbbe1.1
-0.023
znf1101
0.084
fabp10a
-0.023
CU856222.1
0.083
ckma
-0.023
LOC110439829
0.083
XLOC-001975
-0.023
runx2a
0.083
ttn.2
-0.022
RF00096
0.082
csrp2
-0.022
CU499330.1
0.082
akr1b1
-0.022
mob1ba
0.082
thy1
-0.021
si:ch1073-170o4.1
0.082
prss59.2
-0.021
apobb.1
0.081
CELA1 (1 of many)
-0.021