Daniocell
psip1a (pronephros)
PC4 and SFRS1 interacting protein 1a
ZFIN
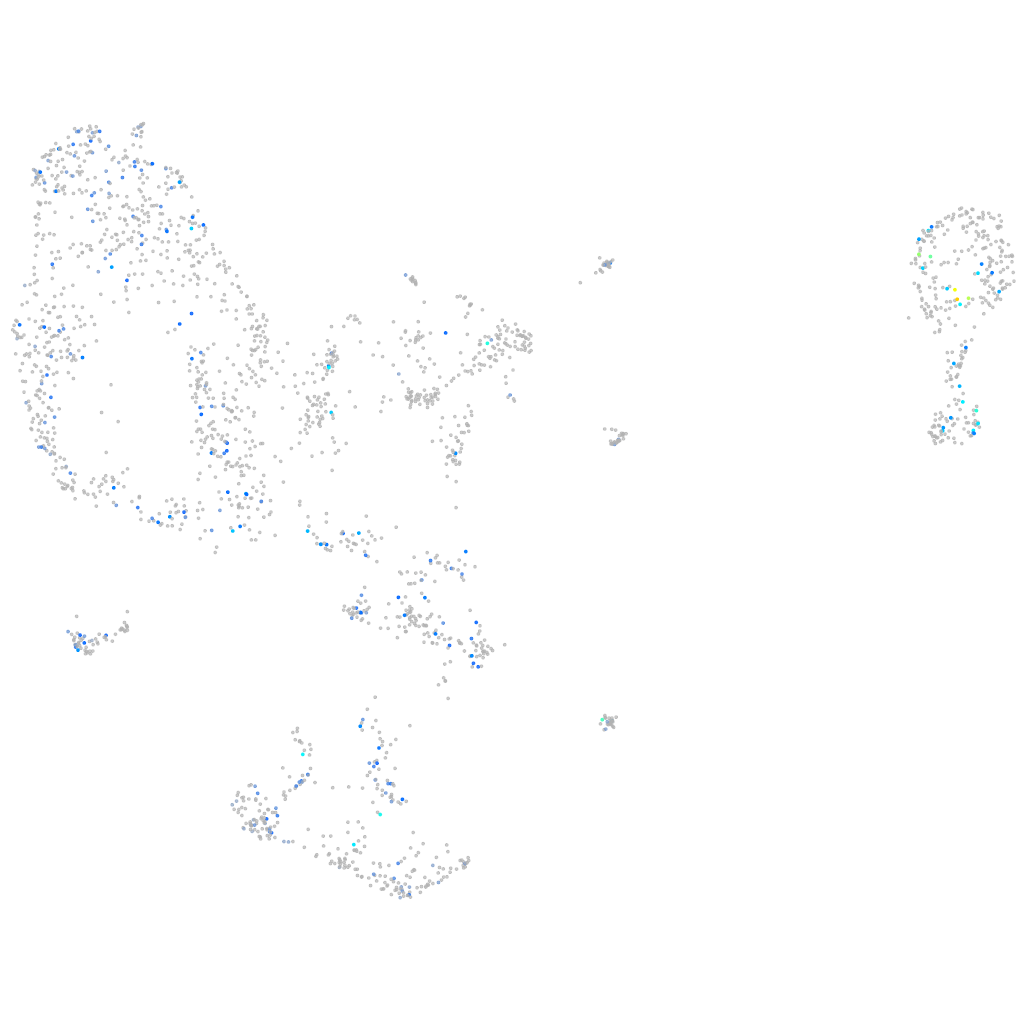
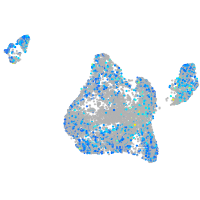
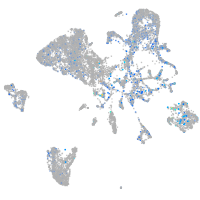
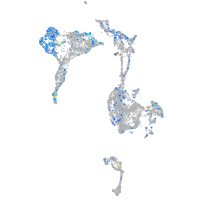
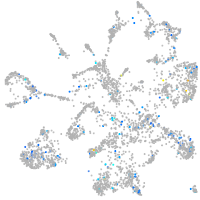
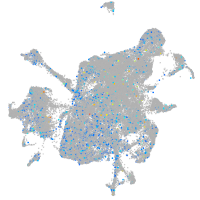
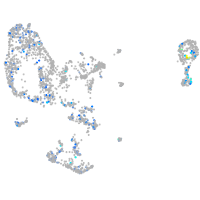
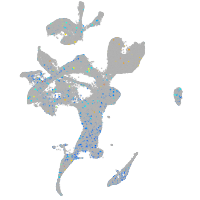
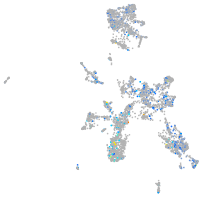
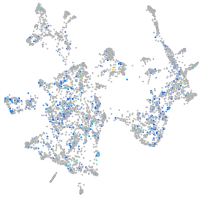
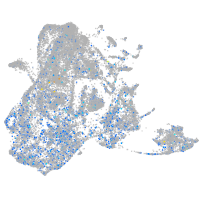
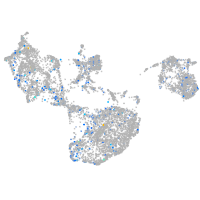
Gene expression UMAP
Display:
Expression
Stage
Other cell groups
all cells
blastomeres
PGCs
endoderm
axial mesoderm
muscle
mural cells /
non-skeletal muscle
mesenchyme
hematopoietic /
vasculature
pronephros
neural
spinal cord / glia
eye
taste / olfactory
otic / lateral line
epidermis
periderm
fin
ionocytes / mucous
pigment cells
Expression by stage/cluster
Correlated gene expression
Positive correlation
Negative correlation
Gene
r
Gene
r
LOC101886407
0.204
pvalb2
-0.082
LOC101885297
0.173
pvalb1
-0.080
CU467646.2
0.166
rpl37
-0.080
si:ch1073-75o15.4
0.166
aldob
-0.073
CR382300.1
0.162
rps17
-0.071
XLOC-004987
0.161
krt4
-0.069
ddx58
0.155
rps10
-0.068
LOC101884154
0.150
mylpfa
-0.067
cd74a
0.149
apoa2
-0.066
si:ch211-215p11.3
0.149
gapdh
-0.065
si:ch211-67e16.3
0.149
icn2
-0.063
si:ch211-198k9.6
0.148
cyt1
-0.062
XLOC-016559
0.147
krt91
-0.061
si:dkey-201l21.4
0.146
icn
-0.061
LOC110440108
0.145
actc1b
-0.061
trim33l
0.143
ahcy
-0.059
si:ch211-135n15.2
0.143
tpma
-0.059
si:dkeyp-59c12.1
0.142
fam120c
-0.059
wnt2bb
0.139
CABZ01072614.1
-0.057
XLOC-003052
0.138
zgc:114188
-0.057
XLOC-036686
0.138
hbae1.1
-0.054
slc4a5a
0.138
si:ch211-139a5.9
-0.053
XLOC-021399
0.138
ndufa2
-0.053
tespa1
0.137
cpt1ab
-0.052
efemp1
0.137
cubn
-0.052
XLOC-030226
0.137
PDPR
-0.052
nkx2.4a
0.137
hbae3
-0.052
ptprc
0.136
st6galnac5b
-0.052
XLOC-038611
0.136
cicb
-0.052
XLOC-018356
0.135
LO016987.2
-0.051
si:dkey-85k15.4
0.134
LOC110439372
-0.051
AL935292.1
0.134
gdi1
-0.051
ackr4a
0.133
gngt2b
-0.050
si:ch73-54f23.4
0.133
atp6v1ab
-0.050
BX005396.1
0.132
NC-002333.17
-0.050