Daniocell
polr3f (pronephros)
polymerase (RNA) III (DNA directed) polypeptide F
ZFIN
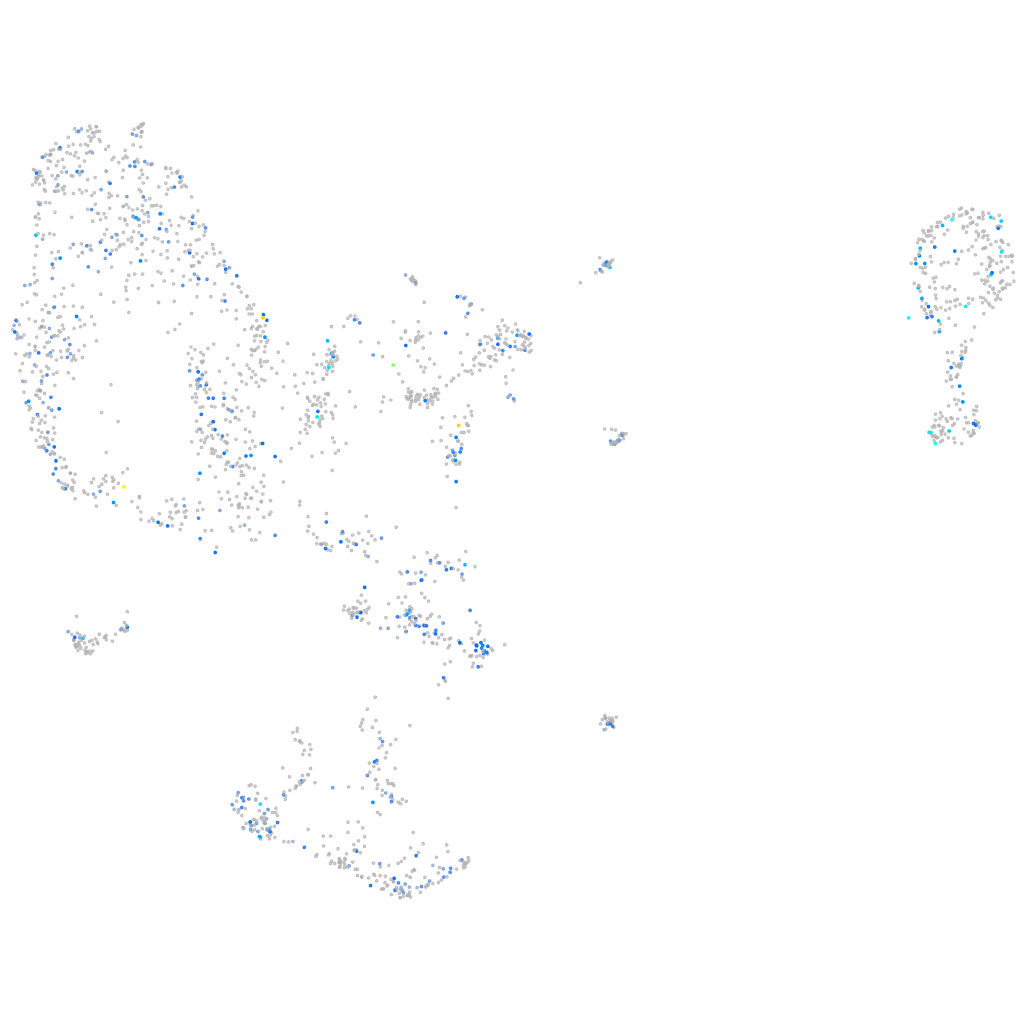
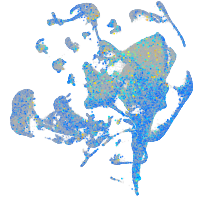
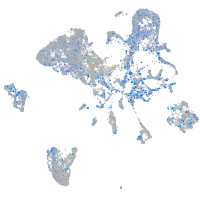
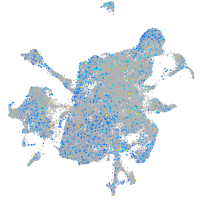
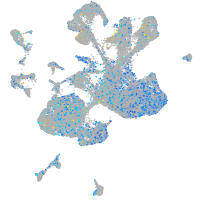
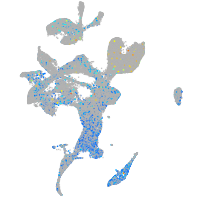
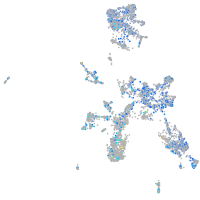
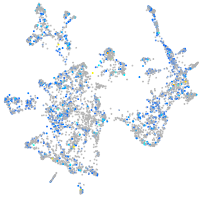
Gene expression UMAP
Display:
Expression
Stage
Other cell groups
all cells
blastomeres
PGCs
endoderm
axial mesoderm
muscle
mural cells /
non-skeletal muscle
mesenchyme
hematopoietic /
vasculature
pronephros
neural
spinal cord / glia
eye
taste / olfactory
otic / lateral line
epidermis
periderm
fin
ionocytes / mucous
pigment cells
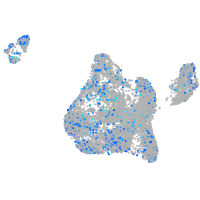
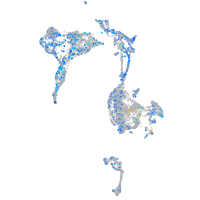
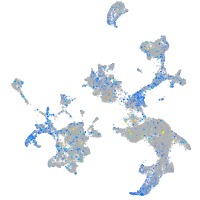
Expression by stage/cluster
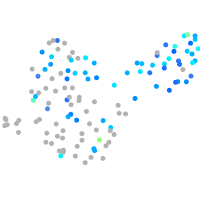
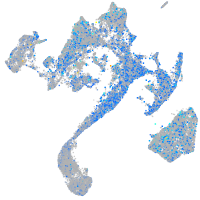
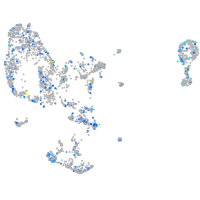
Correlated gene expression
Positive correlation
Negative correlation
Gene
r
Gene
r
zgc:162509
0.169
gss
-0.057
CSDC2 (1 of many)
0.162
agr1
-0.057
si:ch211-255g12.6
0.157
BX855614.1
-0.056
zgc:103755
0.152
kif13ba
-0.055
creb3l1
0.145
atp2a1
-0.054
ush1gb
0.142
mt-nd3
-0.053
XLOC-043229
0.140
bri3
-0.053
XLOC-029608
0.139
cited4a
-0.053
trpm3
0.139
dio3b
-0.052
pcolceb
0.138
itpr1a
-0.052
BX324142.1
0.137
si:ch211-195b11.3
-0.052
tomm20a
0.134
si:dkeyp-27c8.2
-0.052
rpl7l1
0.132
tcnbb
-0.051
CABZ01070747.1
0.131
nit1
-0.051
sept4b
0.129
si:dkey-51a16.9
-0.051
ecm1a
0.128
lgmn
-0.051
grapb
0.128
rgs4
-0.051
psma3
0.128
apool
-0.051
gipc1
0.128
hbae1.1
-0.051
XLOC-035578
0.127
iqgap2
-0.050
si:ch211-217k17.7
0.125
uba52
-0.049
zgc:91999
0.125
tmem106a
-0.049
b3gat1b
0.123
ndrg1a
-0.049
wdr47a
0.122
slc2a2
-0.049
si:dkey-93h22.4
0.122
sik1
-0.048
syt16
0.119
si:dkey-28n18.9
-0.048
itpripl2
0.119
gpr108
-0.048
npm3
0.118
si:dkey-23a13.22
-0.047
myhb
0.118
itm2bb
-0.047
LOC101885698
0.118
gls2b
-0.046
znfl1g
0.118
cfl2
-0.046
LOC108180223
0.115
srp14
-0.046
lrrfip2
0.115
galca
-0.045
mfsd2aa
0.114
mbl2
-0.045
XLOC-042234
0.114
mt-atp8
-0.045