Daniocell
polr2m (mesenchyme)
RNA polymerase II subunit M
ZFIN
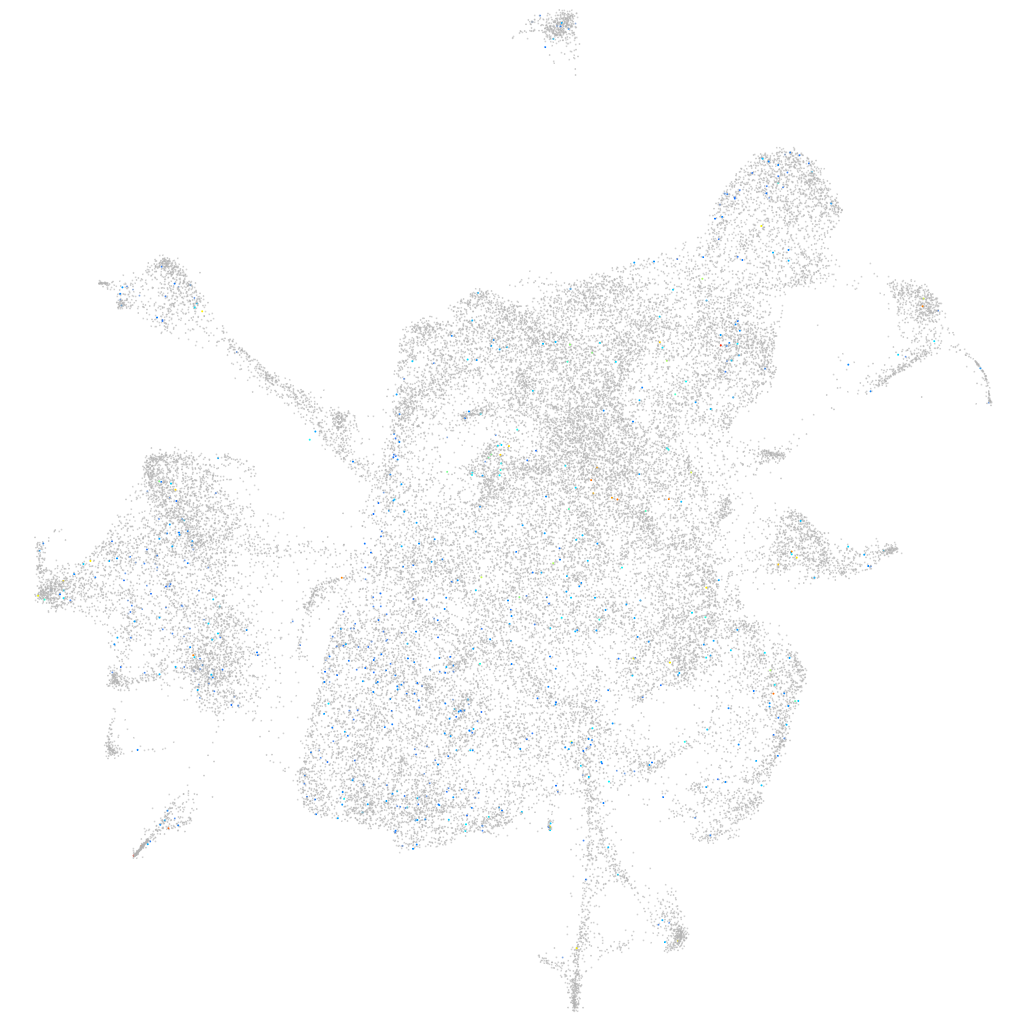
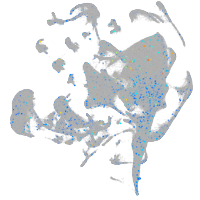
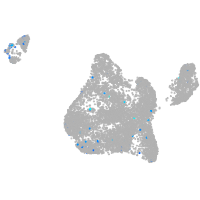
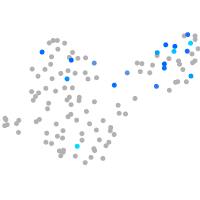
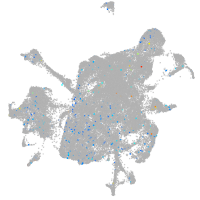
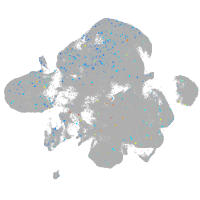
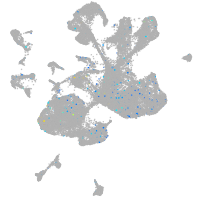
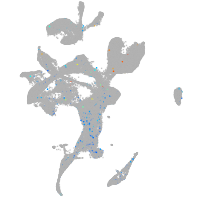
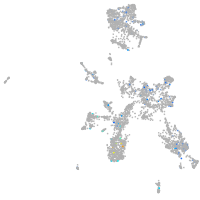
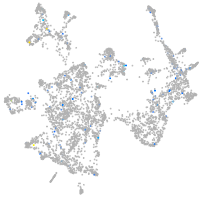
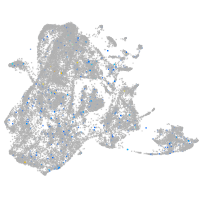
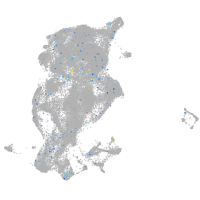
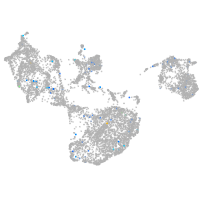
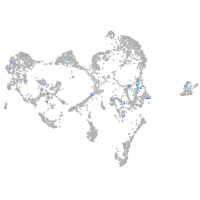
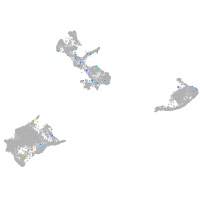
Gene expression UMAP
Display:
Expression
Stage
Other cell groups
all cells
blastomeres
PGCs
endoderm
axial mesoderm
muscle
mural cells /
non-skeletal muscle
mesenchyme
hematopoietic /
vasculature
pronephros
neural
spinal cord / glia
eye
taste / olfactory
otic / lateral line
epidermis
periderm
fin
ionocytes / mucous
pigment cells
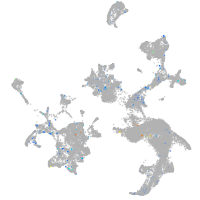
Expression by stage/cluster
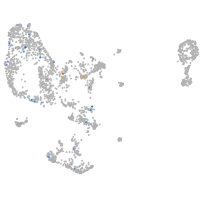
Correlated gene expression
Positive correlation
Negative correlation
Gene
r
Gene
r
LOC110438014
0.068
rbp4
-0.024
LOC101886038
0.065
lxn
-0.018
BX005443.1
0.063
si:ch211-251b21.1
-0.018
SH2D3A
0.061
zgc:136930
-0.018
tmem179b
0.061
pvalb1
-0.017
CR352243.1
0.056
aoc2
-0.017
BX255920.1
0.054
CABZ01092746.1
-0.017
CABZ01057891.1
0.052
wfdc2
-0.016
si:ch211-139n6.3
0.047
apoa2
-0.016
si:ch73-205h11.1
0.047
tob1b
-0.016
or102-2
0.047
cmbl
-0.016
DXO
0.047
zgc:153704
-0.015
si:dkey-202b22.5
0.046
gstz1
-0.015
CR376800.1
0.045
ucmab
-0.015
XLOC-002497
0.044
apoa1b
-0.015
XLOC-030587
0.044
slc43a3b
-0.015
nphs2
0.043
c7a
-0.015
mfsd9
0.043
cdh11
-0.014
csf3r
0.043
ecrg4a
-0.014
CR933839.1
0.043
pvalb2
-0.014
LOC108190047
0.041
rpl35
-0.014
si:dkey-83f18.2
0.041
postna
-0.014
pfn2l
0.041
nme2b.2
-0.014
ptprh
0.039
fabp10a
-0.014
setb
0.039
sesn1
-0.014
CABZ01067980.1
0.038
ifitm1
-0.014
rrm1
0.038
cxcl12a
-0.013
LOC108183923
0.038
CU638870.1
-0.013
snrpe
0.037
rpl38
-0.013
LOC110439832
0.037
crispld1b
-0.013
sumo3b
0.037
cnmd
-0.013
nphs1
0.037
tmem86a
-0.013
sae1
0.037
tsc22d3
-0.013
npffr1l3
0.036
loxl1
-0.013
psma8
0.036
dap1b
-0.013