Daniocell
pnp4b (mural cells / non-skeletal muscle)
purine nucleoside phosphorylase 4b
ZFIN
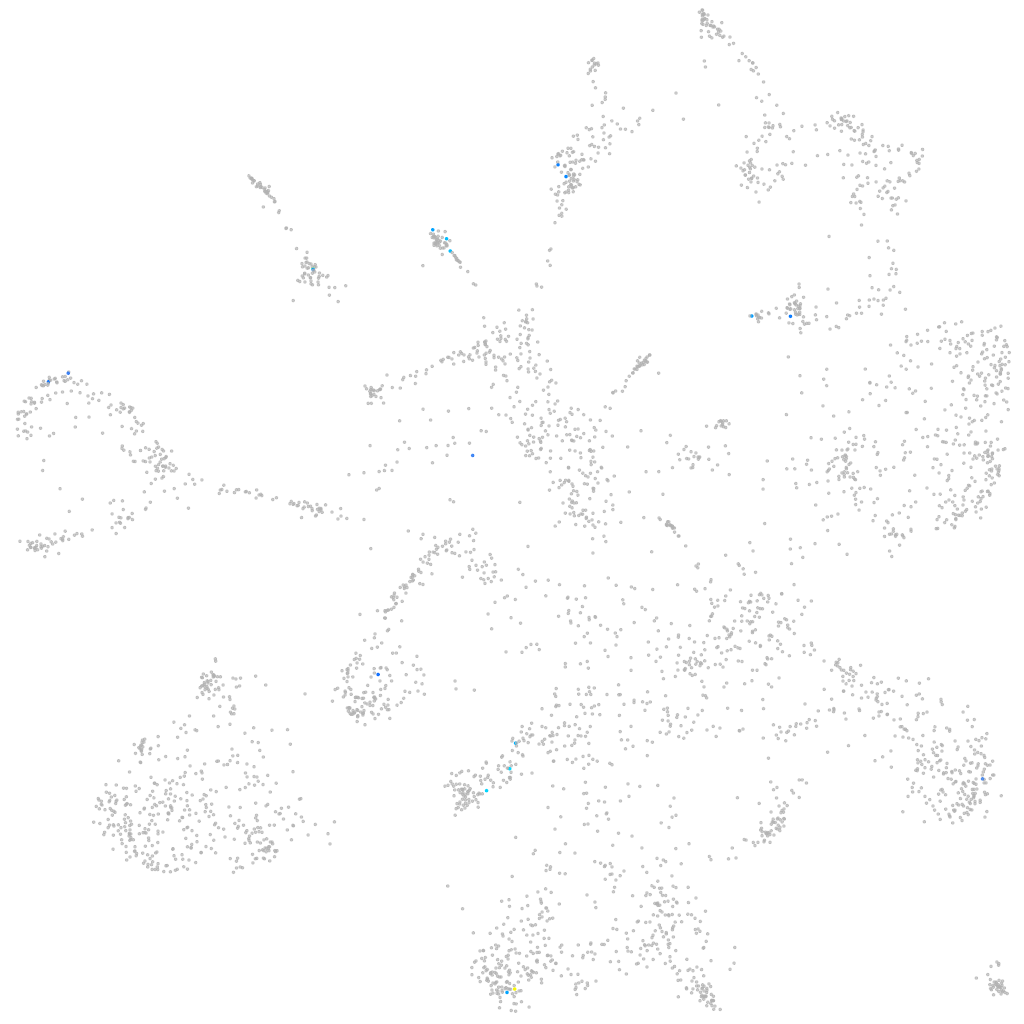
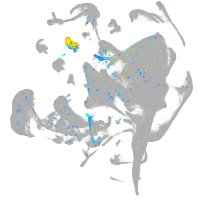
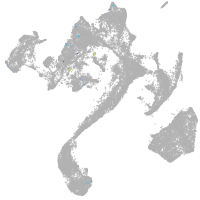
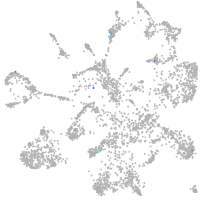
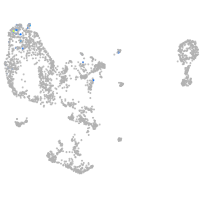
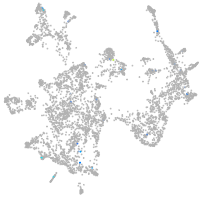
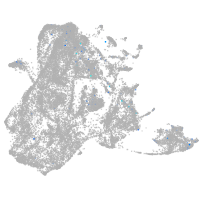
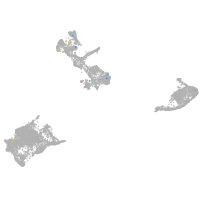
Gene expression UMAP
Display:
Expression
Stage
Other cell groups
all cells
blastomeres
PGCs
endoderm
axial mesoderm
muscle
mural cells /
non-skeletal muscle
mesenchyme
hematopoietic /
vasculature
pronephros
neural
spinal cord / glia
eye
taste / olfactory
otic / lateral line
epidermis
periderm
fin
ionocytes / mucous
pigment cells
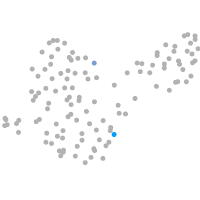
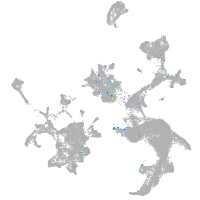
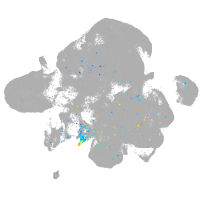
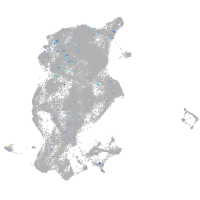
Expression by stage/cluster
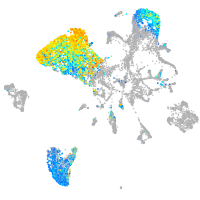
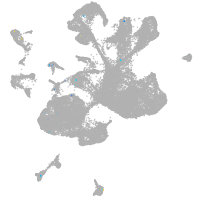
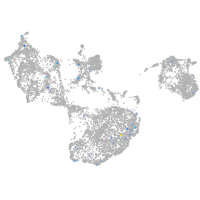
Correlated gene expression
Positive correlation
Negative correlation
Gene
r
Gene
r
si:dkey-221l4.10
0.400
rpl15
-0.073
si:ch73-359m17.9
0.313
rpl5b
-0.064
BFSP1
0.305
rpl18a
-0.051
CU896691.3
0.289
rpl3
-0.049
ahsg2
0.285
rpl29
-0.048
XLOC-005677
0.265
ppp2cb
-0.044
CR925863.1
0.254
mibp2
-0.043
st6galnac1.2
0.243
rpl17
-0.042
si:dkey-46i9.6
0.239
snrpd1
-0.042
sgca
0.235
rps29
-0.042
wee2
0.220
rpl35a
-0.041
si:ch211-218o21.4
0.216
h2afva
-0.041
LOC101882201
0.215
cbx5
-0.041
si:ch211-214k5.3
0.211
uba52
-0.041
LOC103911446
0.205
yap1
-0.041
XLOC-032526
0.197
rpl36
-0.041
stac3
0.195
anp32a
-0.040
lygl2
0.194
hmgb3a
-0.039
pcdh1g3
0.190
rpl28
-0.039
crp3
0.183
pfdn4
-0.039
serpina7
0.180
rpl30
-0.039
p4htm
0.179
seta
-0.039
si:ch211-117n7.7
0.178
ndufab1b
-0.038
si:ch211-214p16.3
0.177
sf3a2
-0.038
or134-1
0.175
snw1
-0.038
fam131c
0.166
zfhx3
-0.038
si:ch211-223a10.1
0.159
marcksb
-0.038
ptgis
0.154
pabpn1
-0.038
tbc1d31
0.152
ppiaa
-0.038
irg1l
0.152
hnrnpl2
-0.038
mocos
0.150
cct4
-0.037
LOC101885981
0.145
si:ch211-133n4.4
-0.037
XLOC-022751
0.144
snu13b
-0.037
bhlha9
0.141
nucks1a
-0.037
oxnad1
0.140
ywhaqb
-0.036