Daniocell
pmpcb (blastomeres)
peptidase (mitochondrial processing) beta
ZFIN
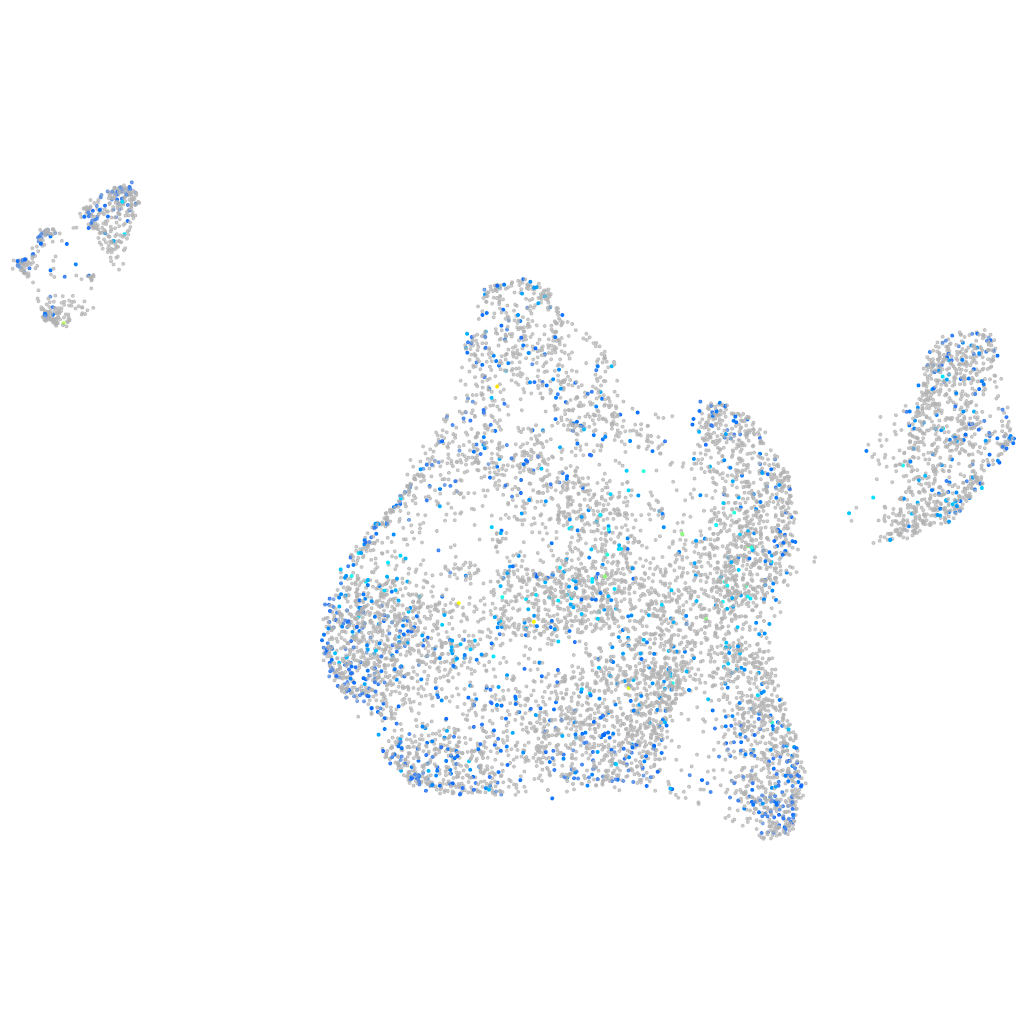
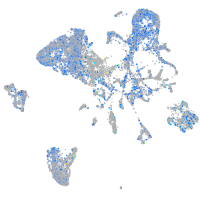
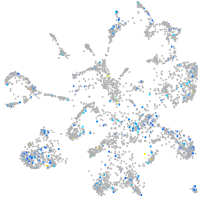
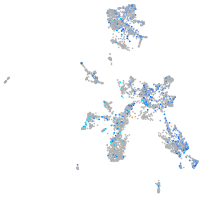
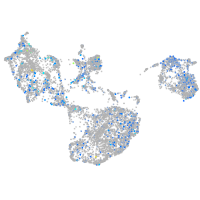
Gene expression UMAP
Display:
Expression
Stage
Other cell groups
all cells
blastomeres
PGCs
endoderm
axial mesoderm
muscle
mural cells /
non-skeletal muscle
mesenchyme
hematopoietic /
vasculature
pronephros
neural
spinal cord / glia
eye
taste / olfactory
otic / lateral line
epidermis
periderm
fin
ionocytes / mucous
pigment cells
Expression by stage/cluster
Correlated gene expression
Positive correlation
Negative correlation
Gene
r
Gene
r
LOC103911601
0.075
NC-002333.4
-0.074
si:dkey-163m14.6
0.065
mcc
-0.035
pimr94
0.063
tmem97
-0.033
ptpro
0.057
tdrd12
-0.031
etv1
0.056
tmem263
-0.030
CABZ01078767.1
0.054
CU655845.1
-0.029
camk2d1
0.054
lyrm5a
-0.029
hepacama
0.054
pon3.2
-0.028
pdzrn3a
0.054
erlec1
-0.028
si:ch211-121a2.2
0.053
CABZ01068600.1
-0.027
cngb3.2
0.052
urahb
-0.027
srprb
0.052
eed
-0.026
CR381686.1
0.052
dctn4
-0.026
ube2e1
0.051
fbxo38
-0.026
LOC108179173
0.051
pcif1
-0.026
dglucy
0.051
sec23b
-0.026
LOC103911301
0.050
hrasb
-0.026
mhc1zka
0.050
CT583687.1
-0.025
CR392001.4
0.050
p4hb
-0.025
CR788226.1
0.050
scaf4a
-0.025
csnk2b
0.050
znf574
-0.025
itga3b
0.049
ncoa3
-0.025
ctslb
0.049
si:dkey-27b3.2
-0.024
LOC110438921
0.049
ntn1b
-0.024
ccl36.1
0.049
ppm1ab
-0.024
cherp
0.049
gdf9
-0.024
cbll1
0.047
tbk1
-0.024
mtss1la
0.047
LOC110439998
-0.024
tpt1
0.047
tuba4l
-0.024
LOC796088
0.047
si:dkey-43f9.4
-0.023
cct3
0.047
palm1b
-0.023
XLOC-003453
0.047
mcamb
-0.023
si:dkey-104n9.1
0.047
si:ch211-199g17.2
-0.023
hoxc1a
0.047
cep104
-0.023
XLOC-010247
0.047
zgc:113263
-0.023