Daniocell
pkz (hematopoietic / vasculature)
protein kinase containing Z-DNA binding domains
ZFIN
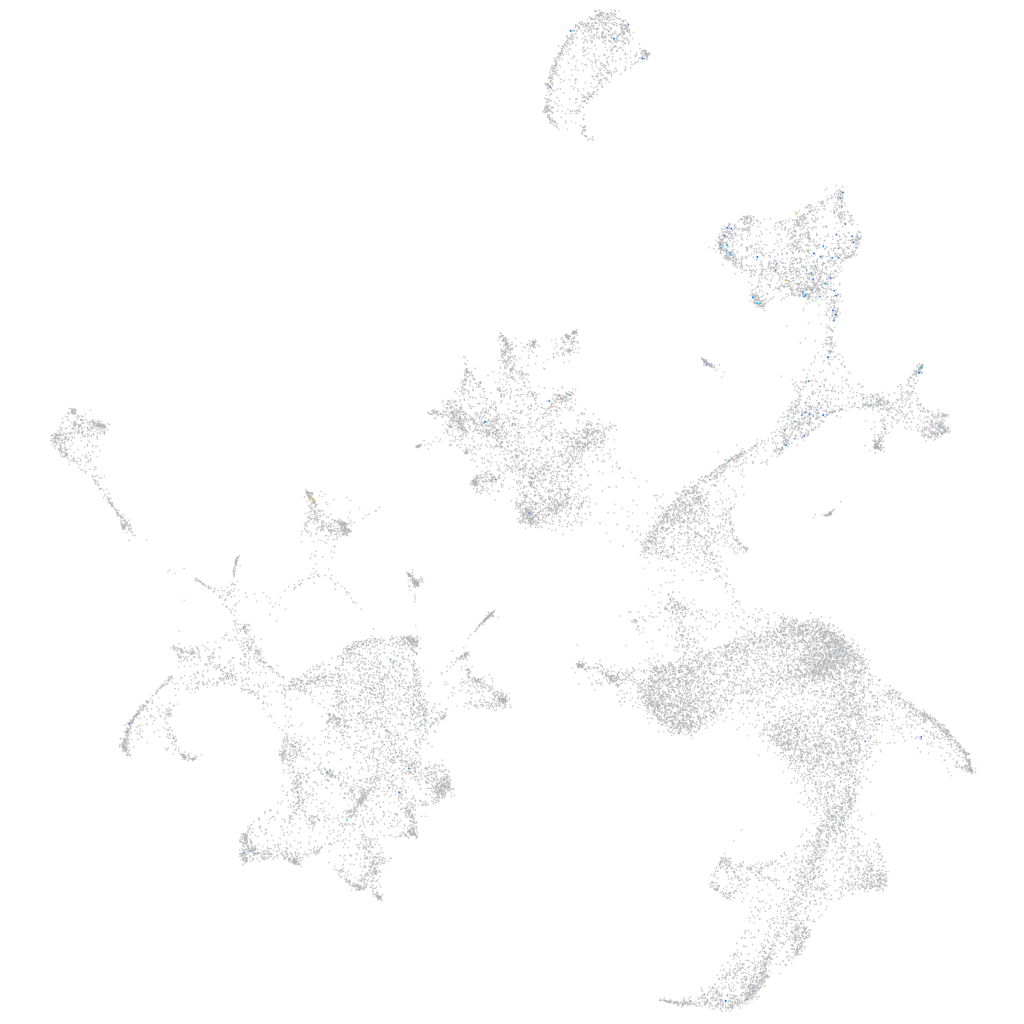
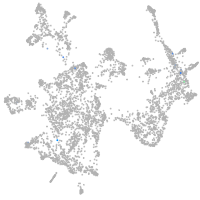
Gene expression UMAP
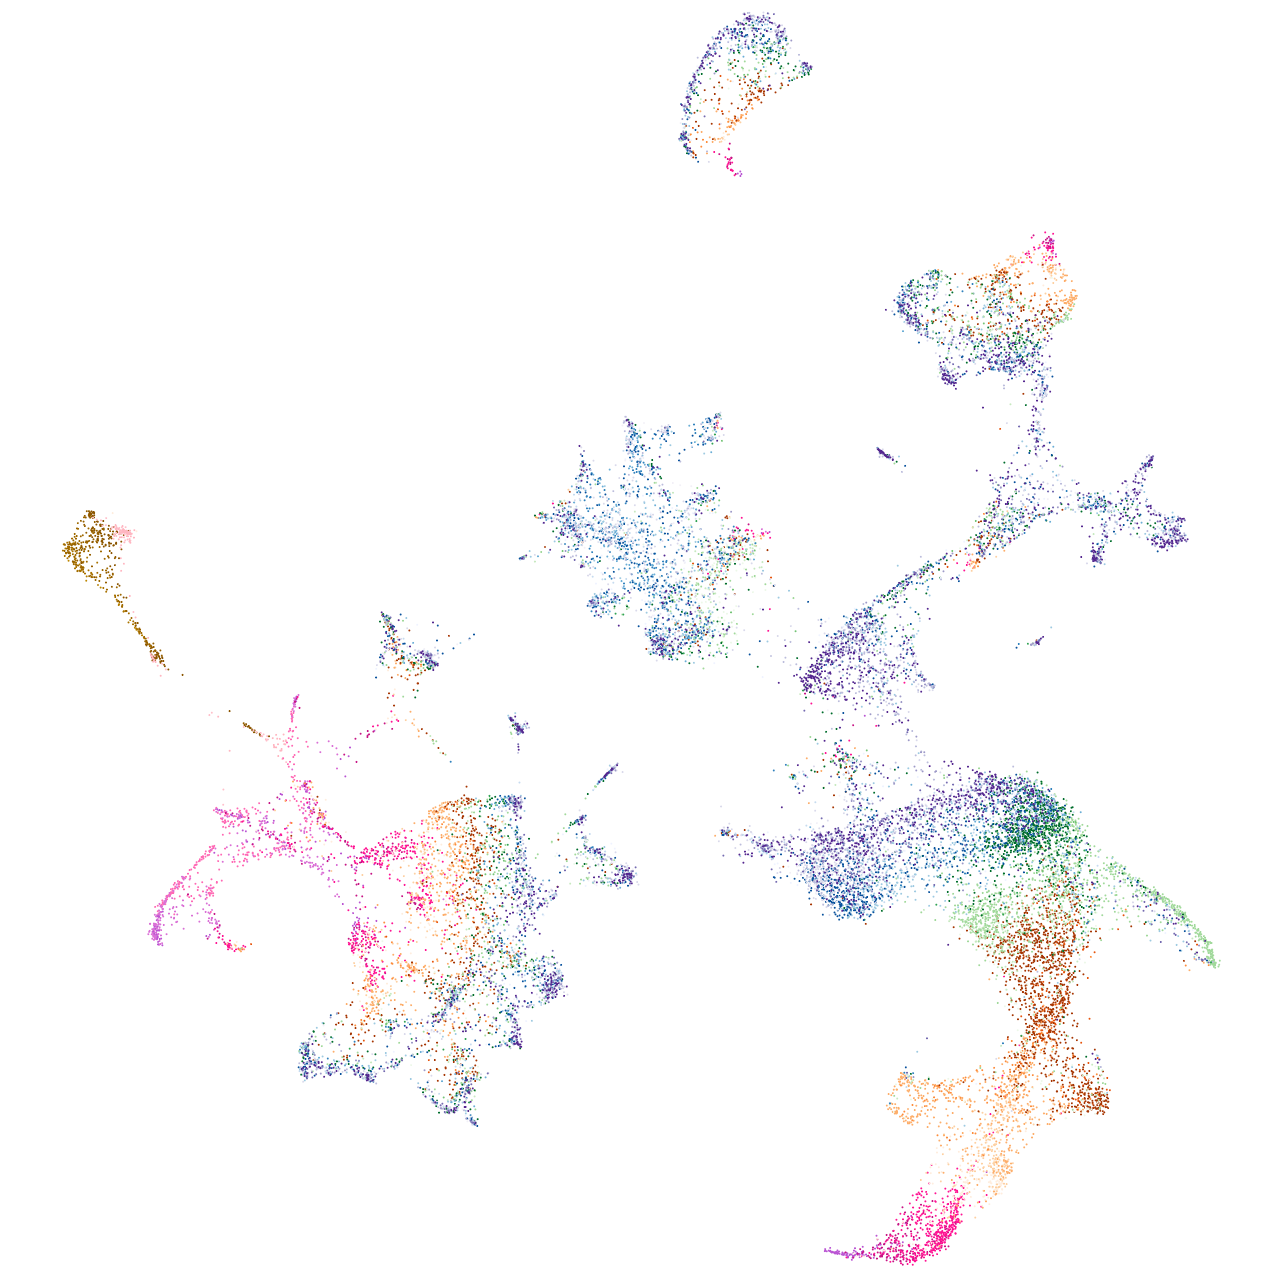
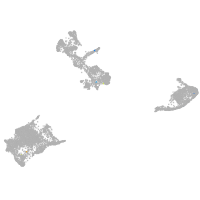
Display:
Expression
Stage
Other cell groups
all cells
blastomeres
PGCs
endoderm
axial mesoderm
muscle
mural cells /
non-skeletal muscle
mesenchyme
hematopoietic /
vasculature
pronephros
neural
spinal cord / glia
eye
taste / olfactory
otic / lateral line
epidermis
periderm
fin
ionocytes / mucous
pigment cells
Expression by stage/cluster
Correlated gene expression
Positive correlation
Negative correlation
Gene
r
Gene
r
CABZ01074304.1
0.229
hbbe2
-0.051
LOC110438169
0.141
hbbe1.3
-0.051
BX005032.1
0.128
hbae1.3
-0.050
nitr4a
0.127
hbae3
-0.050
LOC100150142
0.119
hbae1.1
-0.050
mpp5b
0.115
hbbe1.1
-0.049
XLOC-011861
0.114
cahz
-0.046
CR848715.1
0.112
hbbe1.2
-0.044
CU639412.1
0.108
si:ch211-250g4.3
-0.043
cmklr1
0.104
hemgn
-0.042
ctss2.2
0.103
fth1a
-0.042
havcr1
0.097
creg1
-0.041
si:ch211-1o7.3
0.096
alas2
-0.038
havcr2
0.095
slc4a1a
-0.037
mpeg1.1
0.094
si:ch211-207c6.2
-0.036
cxcr3.2
0.094
blvrb
-0.035
tnfb
0.093
nt5c2l1
-0.035
si:dkey-7i4.19
0.093
epb41b
-0.035
zgc:64051
0.092
zgc:56095
-0.034
lgals2a
0.092
zgc:163057
-0.032
BX664625.5
0.091
plac8l1
-0.032
cd83
0.091
tspo
-0.031
cx32.2
0.091
nmt1b
-0.030
gm2a
0.090
tmod4
-0.030
cyba
0.090
si:ch211-227m13.1
-0.029
cebpb
0.090
histh1l
-0.029
CU499330.1
0.089
si:dkey-240n22.3
-0.028
tlr22
0.088
sptb
-0.027
ptprc
0.088
hbae5
-0.027
ctsc
0.088
TCIM (1 of many)
-0.026
spi1a
0.087
add2
-0.025
si:cabz01030277.1
0.087
klf1
-0.025
zgc:64065
0.087
lmo2
-0.024
lygl1
0.087
tfr1a
-0.024
laptm5
0.087
aqp1a.1
-0.024