
phosphatidylinositol transfer protein cytoplasmic 1b
ZFIN 
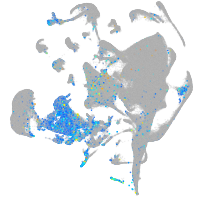
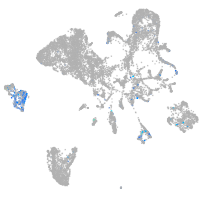
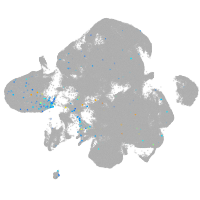
Gene expression UMAP


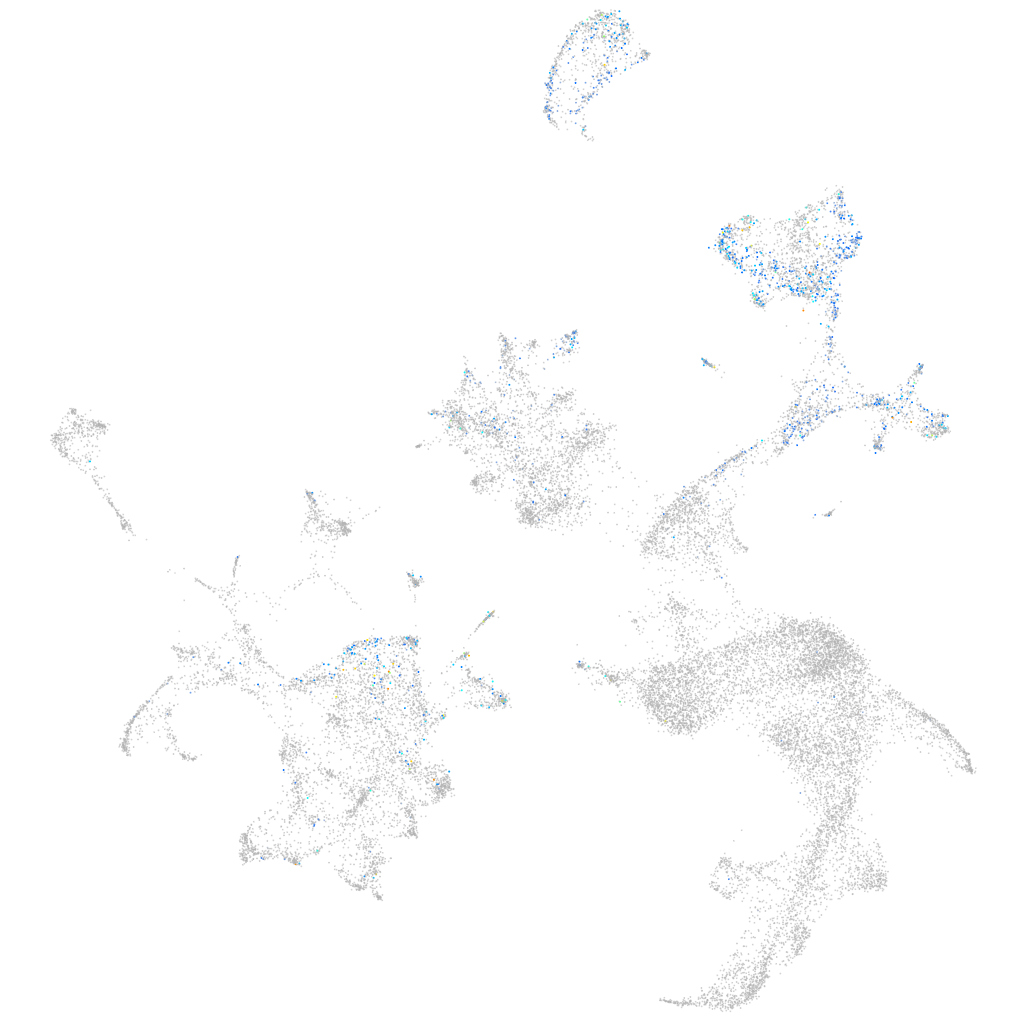

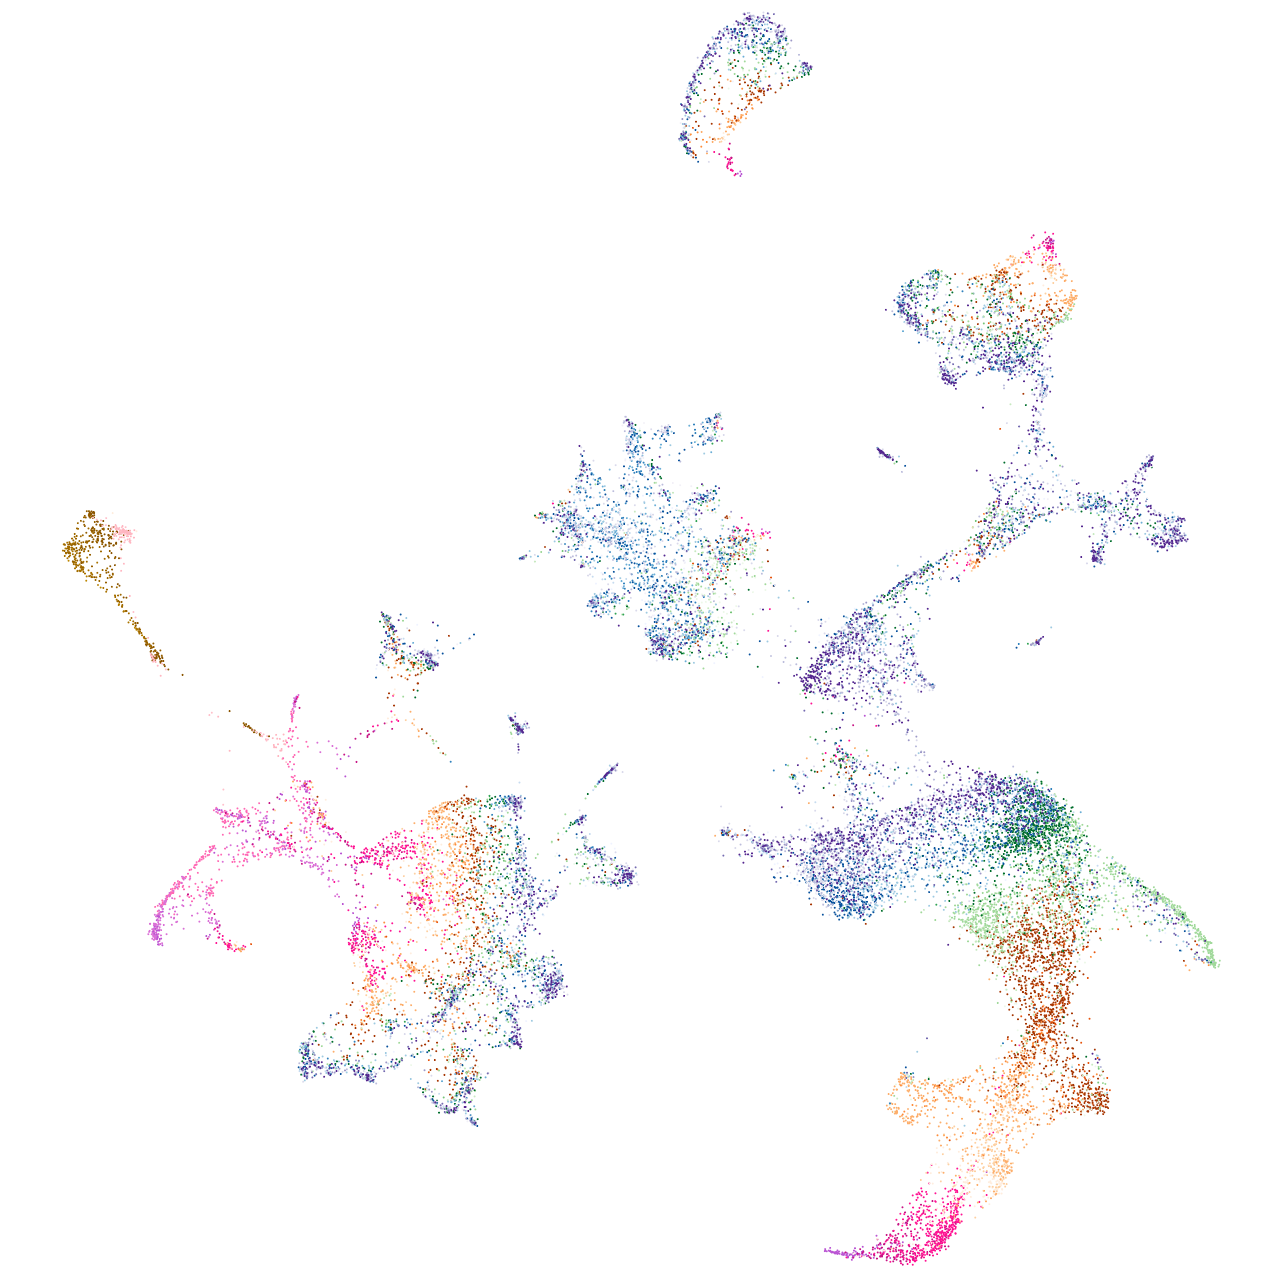


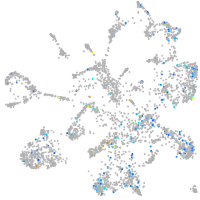


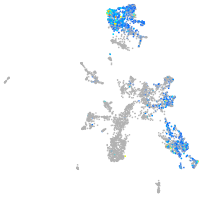

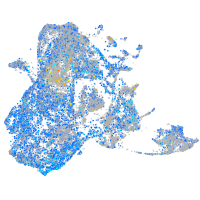
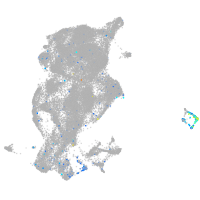

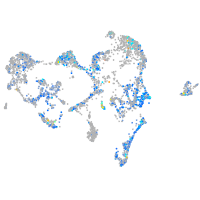

Expression by stage/cluster
Correlated gene expression
| Positive correlation | Negative correlation | ||
| Gene | r | Gene | r |
| cebpb | 0.241 | hbae1.1 | -0.159 |
| arpc1b | 0.225 | hbae3 | -0.157 |
| coro1a | 0.222 | hbae1.3 | -0.155 |
| laptm5 | 0.221 | hbbe2 | -0.153 |
| cotl1 | 0.218 | hbbe1.3 | -0.152 |
| rac2 | 0.216 | hbbe1.1 | -0.147 |
| pfn1 | 0.210 | cahz | -0.143 |
| zgc:64051 | 0.209 | hemgn | -0.137 |
| si:ch211-212k18.7 | 0.208 | fth1a | -0.137 |
| cmklr1 | 0.206 | hbbe1.2 | -0.135 |
| pycard | 0.204 | alas2 | -0.129 |
| arhgdig | 0.203 | blvrb | -0.128 |
| ctss2.1 | 0.203 | slc4a1a | -0.122 |
| CU499330.1 | 0.201 | nt5c2l1 | -0.118 |
| si:ch211-102c2.4 | 0.200 | zgc:56095 | -0.117 |
| slc3a2a | 0.200 | zgc:163057 | -0.117 |
| fcer1gl | 0.196 | si:ch211-250g4.3 | -0.117 |
| zgc:162730 | 0.196 | creg1 | -0.115 |
| eno3 | 0.195 | epb41b | -0.113 |
| spi1b | 0.195 | si:ch211-207c6.2 | -0.107 |
| capgb | 0.194 | tspo | -0.105 |
| itgae.2 | 0.193 | nmt1b | -0.104 |
| cd63 | 0.192 | tmod4 | -0.102 |
| nr4a1 | 0.192 | plac8l1 | -0.095 |
| ctsba | 0.191 | hbae5 | -0.095 |
| il1b | 0.191 | sptb | -0.091 |
| slc7a7 | 0.190 | tfr1a | -0.090 |
| tspan36 | 0.190 | hbbe3 | -0.090 |
| havcr1 | 0.189 | uros | -0.087 |
| cyba | 0.189 | rfesd | -0.086 |
| grap2b | 0.188 | znfl2a | -0.085 |
| gm2a | 0.188 | si:ch211-227m13.1 | -0.083 |
| ptpn6 | 0.187 | dmtn | -0.083 |
| cx32.2 | 0.185 | add2 | -0.082 |
| si:zfos-1069f5.1 | 0.184 | hdr | -0.081 |