Daniocell
pgs1 (mural cells / non-skeletal muscle)
phosphatidylglycerophosphate synthase 1
ZFIN
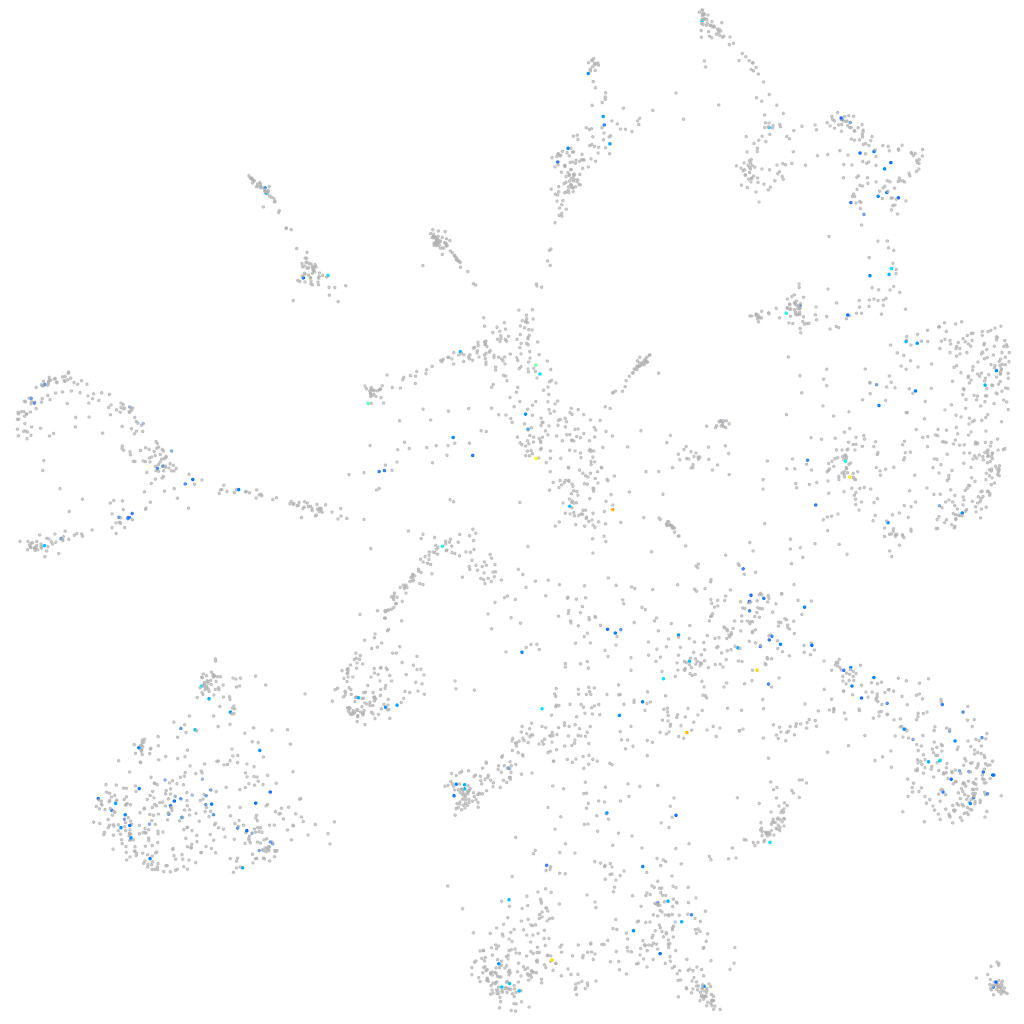
Gene expression UMAP
Display:
Expression
Stage
Other cell groups
all cells
blastomeres
PGCs
endoderm
axial mesoderm
muscle
mural cells /
non-skeletal muscle
mesenchyme
hematopoietic /
vasculature
pronephros
neural
spinal cord / glia
eye
taste / olfactory
otic / lateral line
epidermis
periderm
fin
ionocytes / mucous
pigment cells
Expression by stage/cluster
Correlated gene expression
Positive correlation
Negative correlation
Gene
r
Gene
r
zgc:123181
0.205
apoa1b
-0.060
BX510934.2
0.182
pvalb2
-0.054
npffr1l1
0.177
apoa2
-0.052
si:ch211-226f6.1
0.177
aoc2
-0.051
tbc1d10c
0.175
prss59.2
-0.051
cd4-1
0.152
tpm1
-0.047
CU207301.3
0.146
actc1b
-0.047
zgc:173915
0.146
cxcl14
-0.045
lrig3.2
0.141
CELA1 (1 of many)
-0.045
LOC110438342
0.137
myl9a
-0.043
XLOC-008016
0.137
myhz1.1
-0.043
crhr2
0.136
tagln
-0.042
LOC103909892
0.133
kng1
-0.042
XLOC-042319
0.131
acta2
-0.041
si:dkey-250k10.1
0.130
fabp10a
-0.041
si:dkey-92j16.2
0.129
myl10
-0.039
LOC101885772
0.129
tagln2
-0.037
XLOC-042334
0.124
gngt2b
-0.036
mab21l3
0.124
heca
-0.036
LOC108180305
0.121
cyp2ad3
-0.035
LOC792447
0.121
ctrl
-0.035
scg5
0.121
rbp4
-0.035
LOC101883771
0.118
map1lc3a
-0.035
LOC101883456
0.117
arl2
-0.035
CR457444.7
0.116
tsc22d3
-0.034
map3k8
0.114
ctrb1
-0.034
si:ch211-153b23.3
0.114
lye
-0.034
blf
0.112
rn7sk
-0.034
chst12b
0.111
si:ch73-25f10.6
-0.034
znf1013
0.109
ier2b
-0.034
sim1a
0.107
LOC110439372
-0.034
cax2
0.106
lpin1
-0.034
XLOC-043113
0.105
ela3l
-0.033
XLOC-042915
0.105
ifitm1
-0.033
BX649434.2
0.105
prss1
-0.033