Daniocell
pgs1 (fin)
phosphatidylglycerophosphate synthase 1
ZFIN
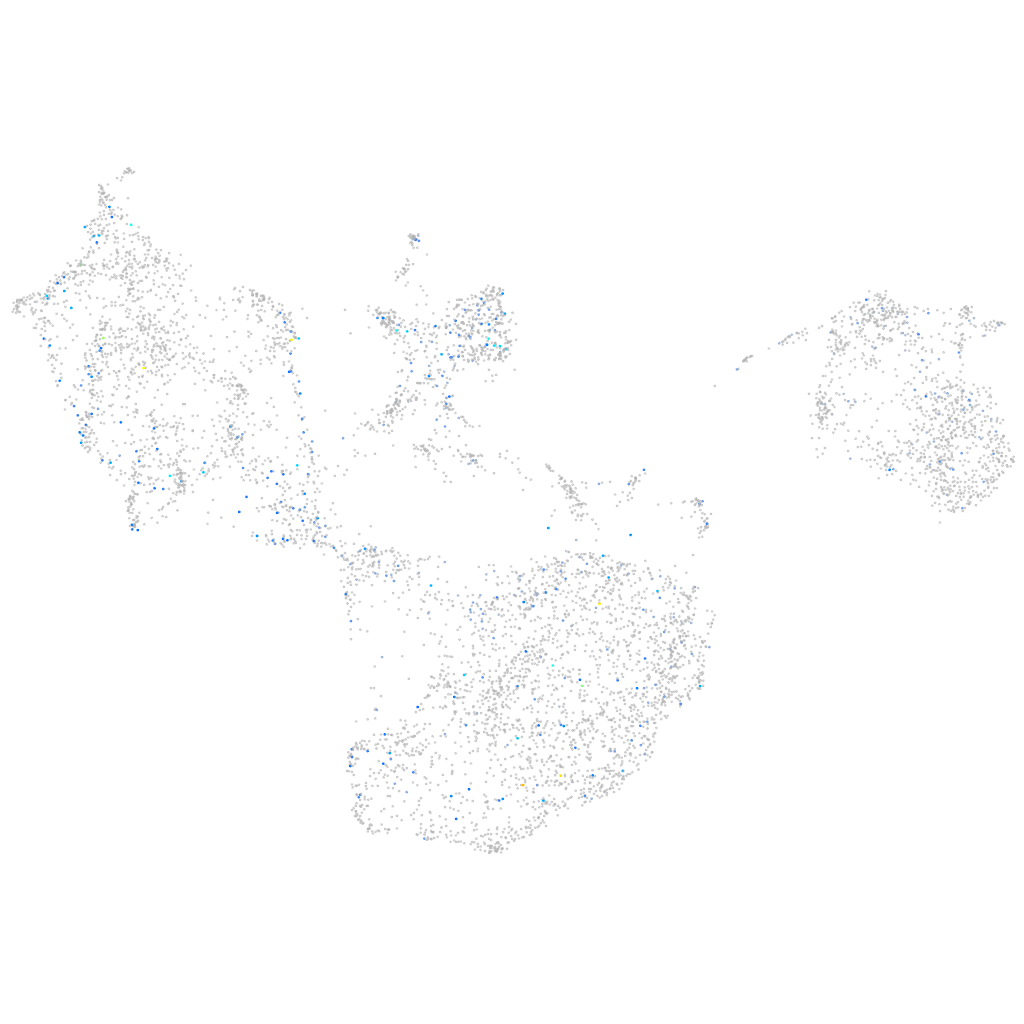
Gene expression UMAP
Display:
Expression
Stage
Other cell groups
all cells
blastomeres
PGCs
endoderm
axial mesoderm
muscle
mural cells /
non-skeletal muscle
mesenchyme
hematopoietic /
vasculature
pronephros
neural
spinal cord / glia
eye
taste / olfactory
otic / lateral line
epidermis
periderm
fin
ionocytes / mucous
pigment cells
Expression by stage/cluster
Correlated gene expression
Positive correlation
Negative correlation
Gene
r
Gene
r
RF00566
0.157
tob1b
-0.052
BX324132.2
0.135
icn2
-0.051
LOC110439573
0.131
rbp4
-0.049
si:dkeyp-3f10.16
0.125
mgst1.2
-0.048
cmlc1
0.121
si:ch211-195b11.3
-0.047
CU207301.3
0.117
si:dkey-222n6.2
-0.046
CABZ01069436.1
0.117
aldob
-0.046
LOC110438399
0.113
lye
-0.045
FP565432.1
0.110
pnp5a
-0.044
XLOC-020450
0.108
tcnbb
-0.044
pdzd3a
0.106
cast
-0.043
LOC101884156
0.105
zgc:193505
-0.043
hnrnpa0b
0.104
anxa1b
-0.042
RF00334
0.103
si:ch211-207n23.2
-0.042
FO681288.1
0.102
si:dkey-248g15.3
-0.042
si:ch211-132f19.7
0.101
wu:fb18f06
-0.042
CU463033.1
0.100
selenow2b
-0.041
CR855320.3
0.098
wu:fa03e10
-0.041
CR936518.2
0.098
cldnb
-0.041
ddx39ab
0.097
si:ch211-125o16.4
-0.040
CU326349.1
0.096
ankrd22
-0.039
FO704819.1
0.095
anxa1c
-0.039
hnrnpa0a
0.093
stard14
-0.039
h2afvb
0.093
krt17
-0.039
FQ311924.2
0.093
si:dkey-33c14.3
-0.039
lrrtm4l1
0.091
hrc
-0.039
zgc:112998
0.091
tmsb1
-0.039
fbxo36b
0.090
arl5c
-0.039
cirbpb
0.089
CR854839.1
-0.039
cbx5
0.088
nqo1
-0.039
LOC110439397
0.088
agr1
-0.039
tlr4ba
0.087
homer2
-0.039
calr
0.087
ak1
-0.038
marcksb
0.086
znf185
-0.038
ilf2
0.086
aqp3a
-0.038