
phosphoglycerate mutase 1a
ZFIN 
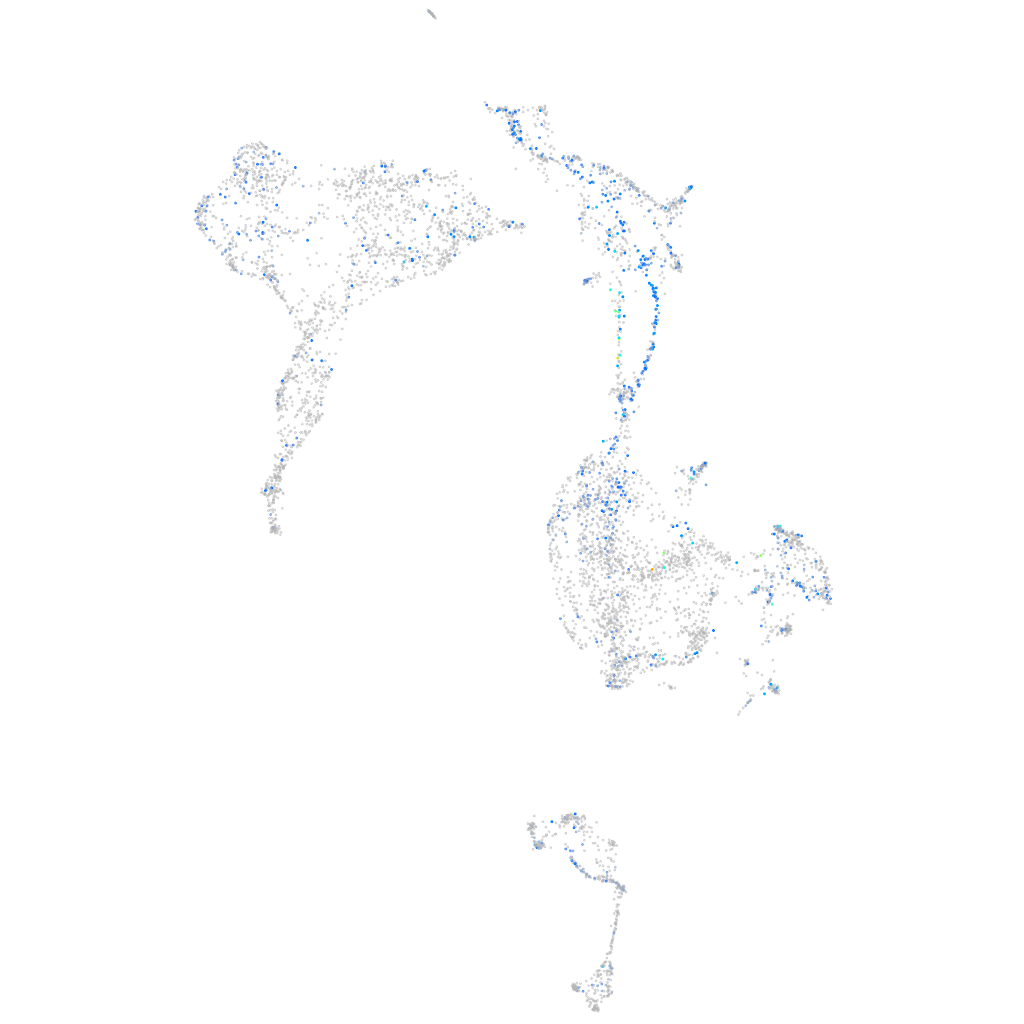
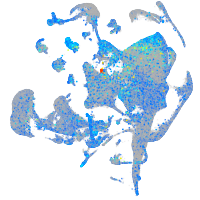
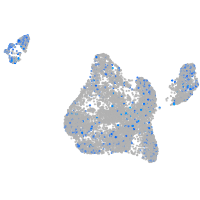
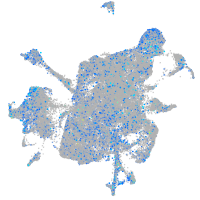
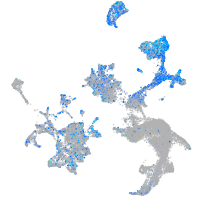
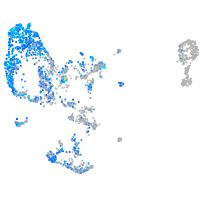
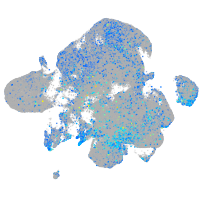
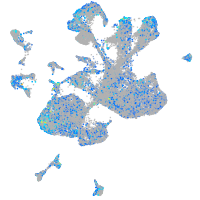
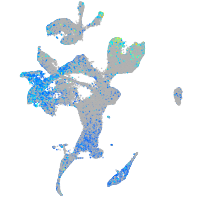
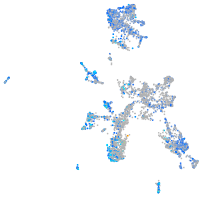
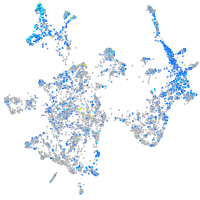
Gene expression UMAP


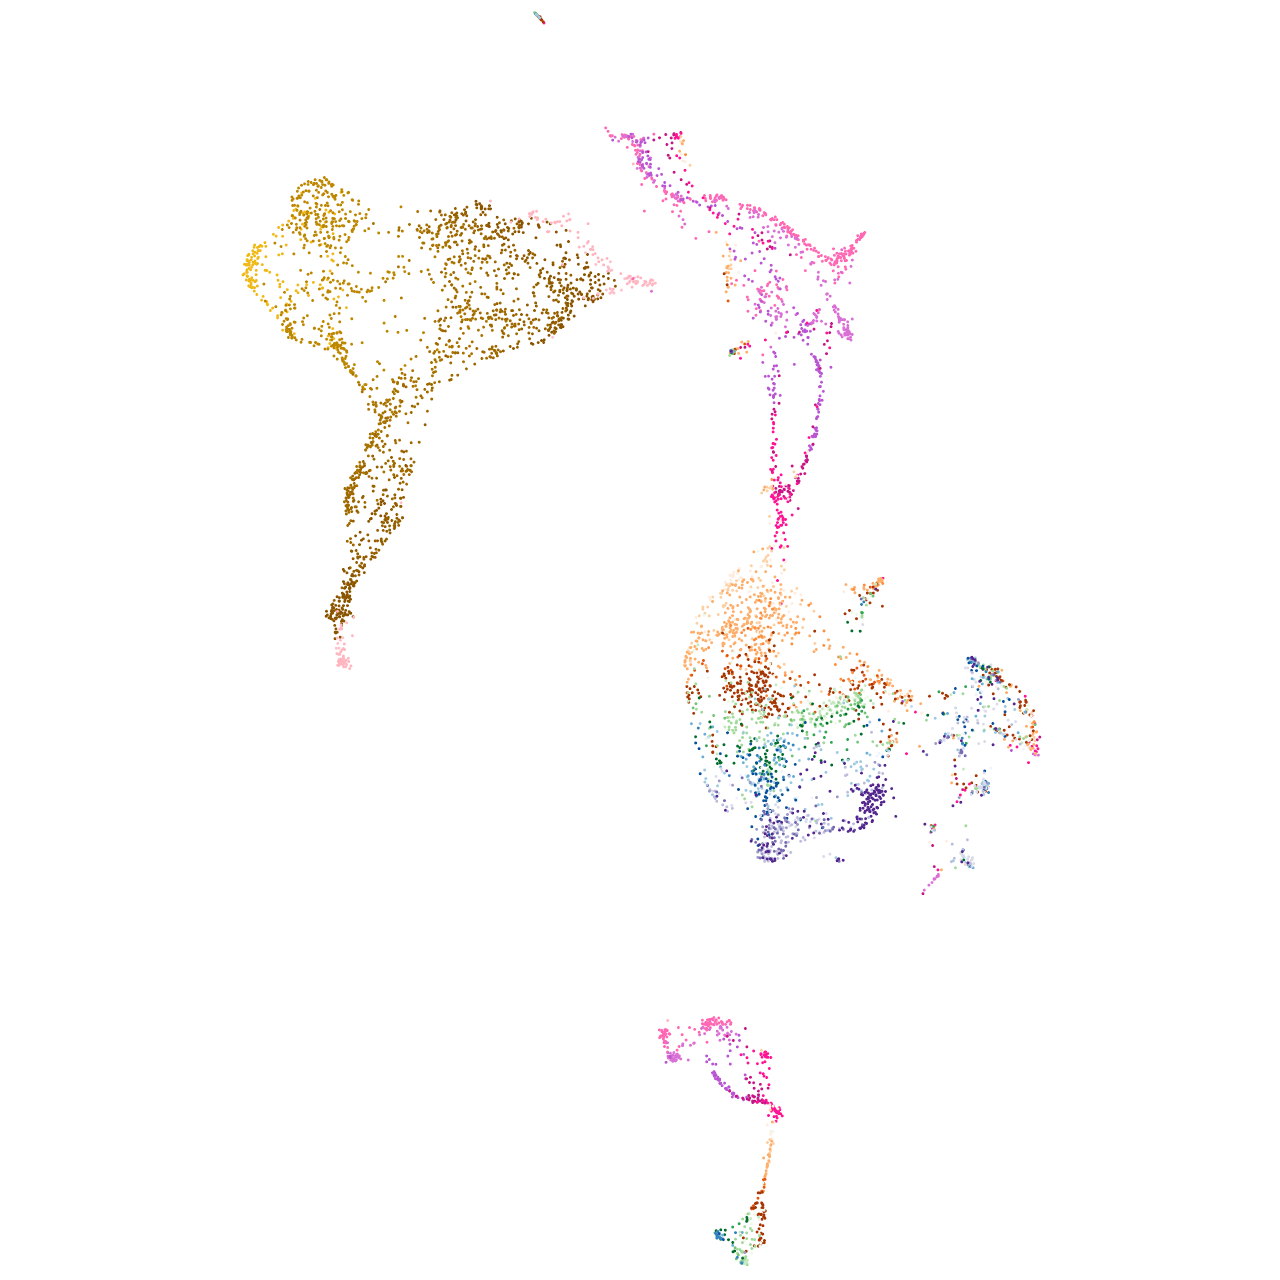


Expression by stage/cluster
Correlated gene expression
| Positive correlation | Negative correlation | ||
| Gene | r | Gene | r |
| tpi1b | 0.330 | rps18 | -0.098 |
| eno1a | 0.325 | ncl | -0.096 |
| gpia | 0.325 | fbl | -0.095 |
| ndufa4 | 0.323 | stm | -0.094 |
| gapdhs | 0.303 | snrnp70 | -0.088 |
| aldocb | 0.291 | ptmab | -0.088 |
| pgk1 | 0.249 | lyar | -0.088 |
| loxl5b | 0.235 | ddx18 | -0.087 |
| p4ha1b | 0.224 | metap2b | -0.087 |
| aldoaa | 0.220 | hnrnpa1b | -0.086 |
| ndrg1a | 0.215 | abcf1 | -0.086 |
| ldha | 0.214 | chd4b | -0.084 |
| col5a3a | 0.214 | ilf3b | -0.083 |
| wu:fc23c09 | 0.213 | zmp:0000000624 | -0.083 |
| COX7A2 (1 of many) | 0.206 | nop58 | -0.082 |
| hapln1a | 0.195 | nop56 | -0.082 |
| cd151l | 0.191 | mybbp1a | -0.082 |
| cox6b1 | 0.191 | frzb | -0.082 |
| lgals1l1 | 0.182 | hnrnpub | -0.081 |
| smoc2 | 0.178 | si:ch211-152c2.3 | -0.081 |
| actb2 | 0.178 | bms1 | -0.080 |
| col15a1a | 0.175 | ebna1bp2 | -0.079 |
| cox6a2 | 0.173 | matn3a | -0.079 |
| grasp | 0.172 | gnl3 | -0.079 |
| tspan7b | 0.172 | fam50a | -0.079 |
| lama5 | 0.170 | anp32e | -0.079 |
| cav3 | 0.170 | atp1b1a | -0.079 |
| irf2bp2b | 0.168 | hnrnpa1a | -0.078 |
| FQ323119.1 | 0.165 | apoeb | -0.077 |
| ntd5 | 0.164 | nop2 | -0.077 |
| hhipl2 | 0.164 | pes | -0.077 |
| ece1 | 0.163 | eif2s1a | -0.077 |
| plod1a | 0.162 | hnrnpm | -0.077 |
| tinagl1 | 0.160 | add3b | -0.076 |
| nog2 | 0.160 | brd3a | -0.076 |