Daniocell
pdrg1 (blastomeres)
p53 and DNA-damage regulated 1
ZFIN
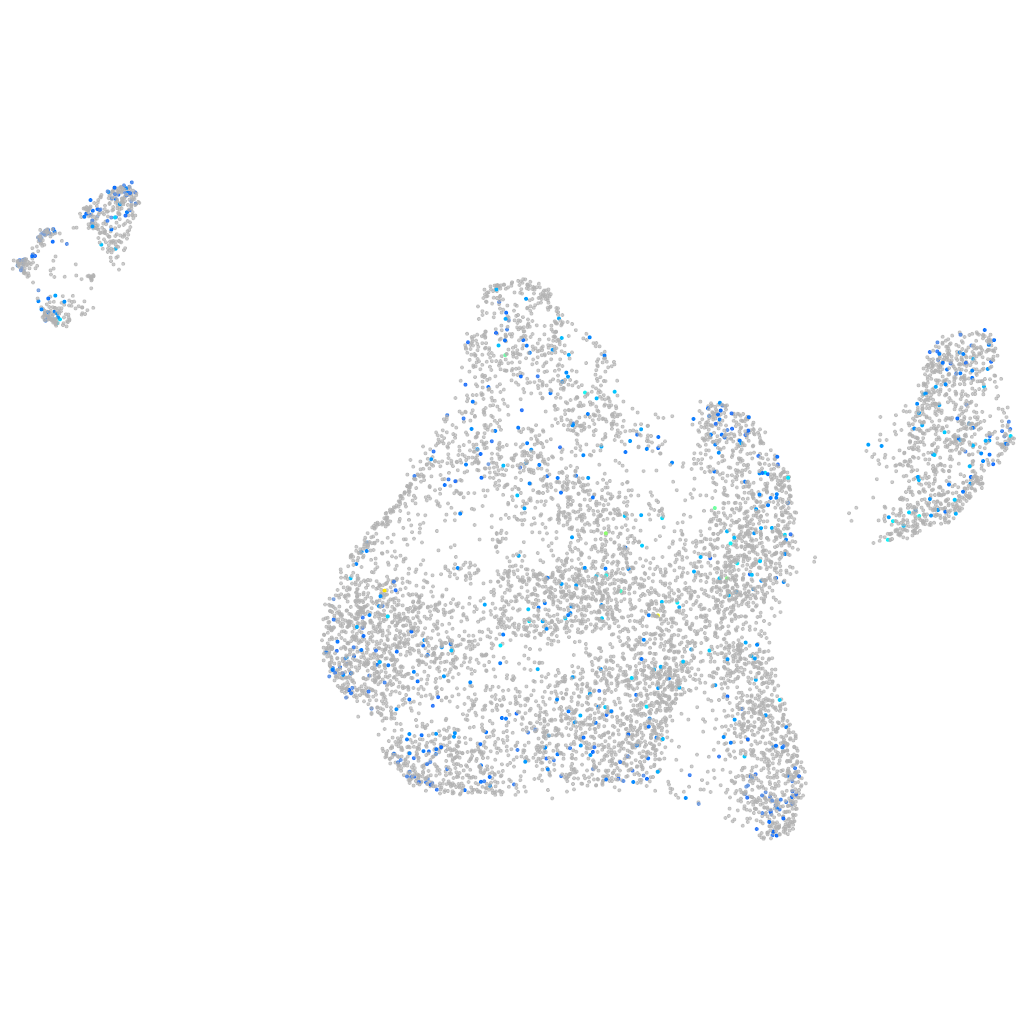
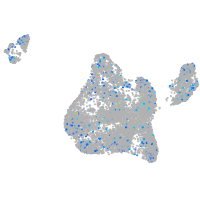
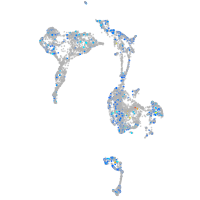
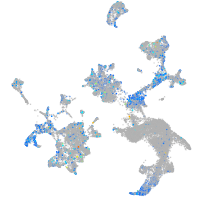
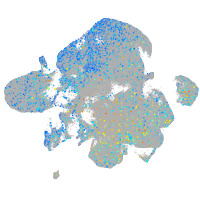
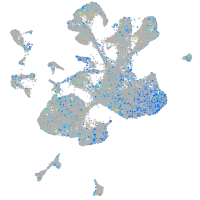
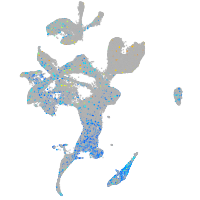
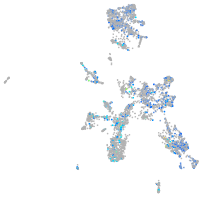
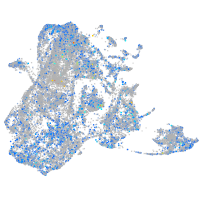
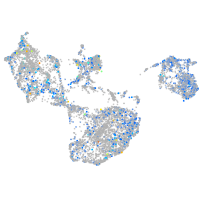
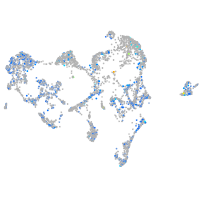
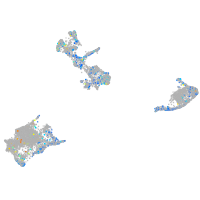
Gene expression UMAP
Display:
Expression
Stage
Other cell groups
all cells
blastomeres
PGCs
endoderm
axial mesoderm
muscle
mural cells /
non-skeletal muscle
mesenchyme
hematopoietic /
vasculature
pronephros
neural
spinal cord / glia
eye
taste / olfactory
otic / lateral line
epidermis
periderm
fin
ionocytes / mucous
pigment cells
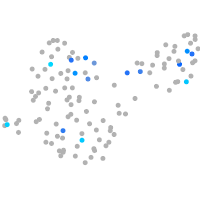
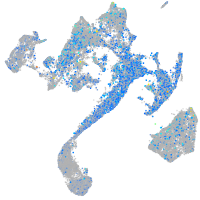
Expression by stage/cluster
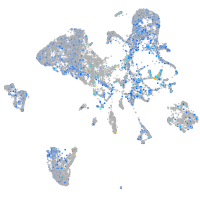
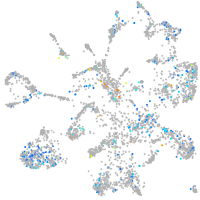
Correlated gene expression
Positive correlation
Negative correlation
Gene
r
Gene
r
sstr2b
0.085
si:ch211-152c2.3
-0.063
LOC110438080
0.083
hspb1
-0.061
LOC101882251
0.080
dynll1
-0.061
acp5a
0.079
si:ch211-222l21.1
-0.059
XLOC-042563
0.075
hnrnpa0b
-0.058
uck2a
0.073
eef1a1l1
-0.058
cxcl8b.3
0.072
hmga1a
-0.058
ska2
0.072
hmgb2a
-0.056
BX323586.1
0.071
si:ch73-1a9.3
-0.053
LOC110438143
0.071
si:dkey-151g10.6
-0.052
or133-2
0.071
snrpd1
-0.051
dctpp1
0.071
rplp0
-0.050
avpr1ab
0.070
rpl27
-0.049
cldng
0.070
marcksl1b
-0.047
CABZ01069022.2
0.069
rpl13a
-0.047
apopt1
0.069
cirbpb
-0.047
ccnb2
0.068
stm
-0.046
rln
0.068
polr3gla
-0.046
LOC101882067
0.068
apoeb
-0.045
lgi2b
0.067
rpl35
-0.045
ap1s3b
0.066
khdrbs1a
-0.045
arfip1
0.065
rps2
-0.044
mknk2a
0.065
ptmab
-0.044
gtf2a1
0.065
hmgn6
-0.044
si:dkey-17m8.2
0.065
add3b
-0.043
rap2c
0.065
lrwd1
-0.043
scyl3
0.065
rps12
-0.042
ablim1a
0.064
rpl7a
-0.042
zgc:113424
0.064
rps29
-0.041
coil
0.064
gpd1b
-0.041
si:ch1073-174d20.1
0.064
si:ch73-281n10.2
-0.041
pabpn1l
0.064
NC-002333.4
-0.041
LOC101885283
0.064
rpl22
-0.041
tmem42a
0.064
rpl36a
-0.040
map1lc3c
0.064
aldob
-0.040