Daniocell
pdgfbb (periderm)
platelet-derived growth factor beta polypeptide b
ZFIN
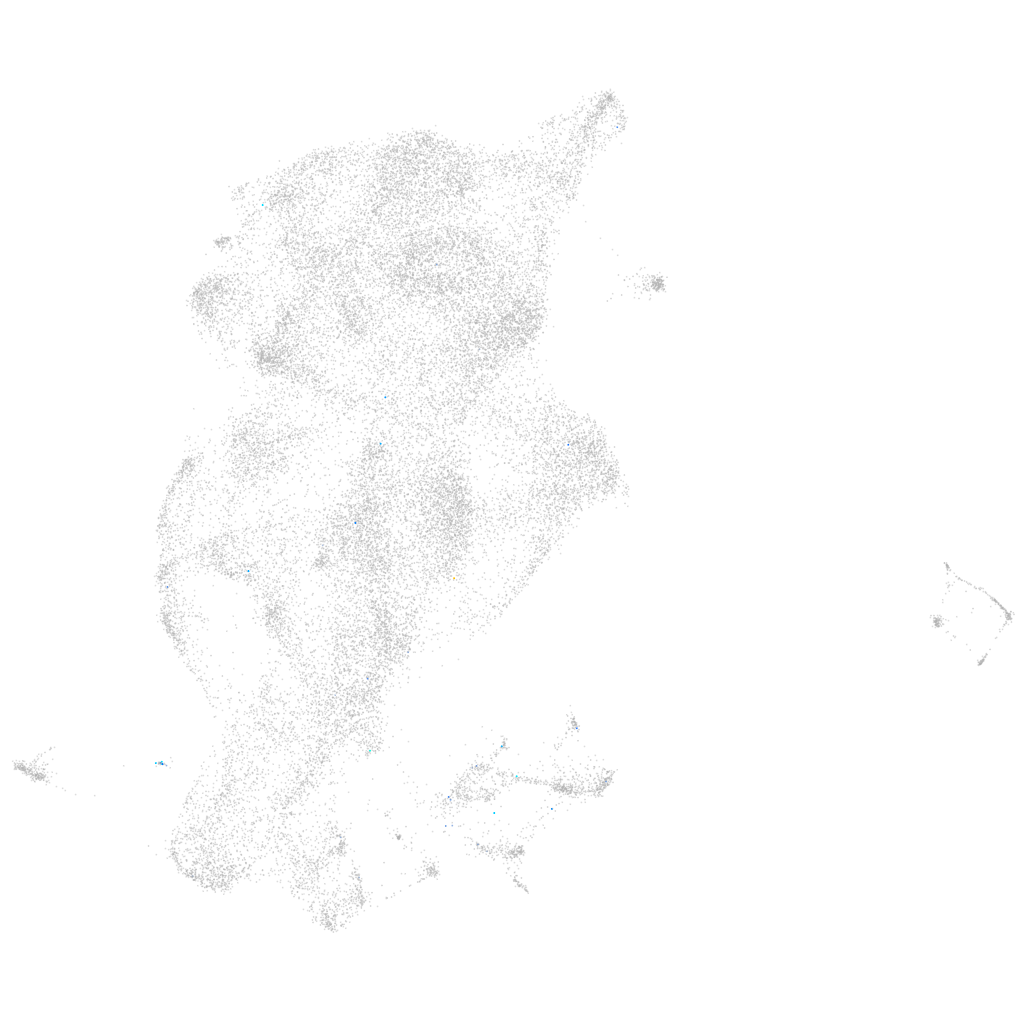
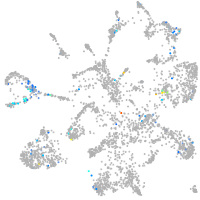
Gene expression UMAP
Display:
Expression
Stage
Other cell groups
all cells
blastomeres
PGCs
endoderm
axial mesoderm
muscle
mural cells /
non-skeletal muscle
mesenchyme
hematopoietic /
vasculature
pronephros
neural
spinal cord / glia
eye
taste / olfactory
otic / lateral line
epidermis
periderm
fin
ionocytes / mucous
pigment cells
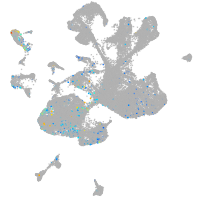
Expression by stage/cluster
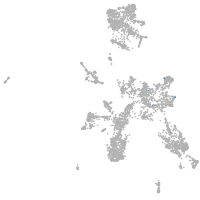
Correlated gene expression
Positive correlation
Negative correlation
Gene
r
Gene
r
LOC110439979
0.258
selenow1
-0.028
XLOC-041467
0.223
si:ch73-52f15.5
-0.026
cdh5
0.211
cyt1
-0.025
XLOC-035229
0.208
cfl1l
-0.024
tiam2b
0.193
agr1
-0.023
tie1
0.183
krt5
-0.023
si:ch211-222n4.2
0.182
si:ch211-195b11.3
-0.023
flt1
0.181
si:ch211-157c3.4
-0.022
LOC101882826
0.180
selenow2b
-0.021
bcl6b
0.172
gsta.1
-0.021
plvapb
0.166
krt4
-0.020
plvapa
0.164
dhrs13a.2
-0.020
tnfaip2b
0.159
si:dkey-184p9.7
-0.020
mcamb
0.158
anxa1a
-0.019
XLOC-024206
0.158
cav2
-0.019
LOC101883563
0.156
pycard
-0.019
pcdh12
0.154
mgst2
-0.019
ebf3b
0.149
zgc:175088
-0.018
cldn5b
0.148
eevs
-0.018
FP236157.3
0.148
zgc:163030
-0.018
slc38a8a
0.143
krt17
-0.018
zgc:114120
0.142
ywhabl
-0.018
ptprja
0.136
cst14b.1
-0.017
hlx1
0.133
aldob
-0.017
si:dkey-1c11.1
0.131
soul2
-0.017
tgfbr2a
0.131
tmem54a
-0.017
phactr1
0.126
zgc:193505
-0.017
hey2
0.120
cyt1l
-0.017
myct1a
0.120
spint2
-0.017
ptprb
0.118
glo1
-0.016
si:ch211-33e4.2
0.118
si:dkeyp-11e3.1
-0.016
LOC101882303
0.116
s100w
-0.016
tmem88a
0.113
s100a10b
-0.016
LOC110439128
0.113
cldne
-0.016
pecam1
0.113
sh3gl1a
-0.016