Daniocell
pbx2 (ionocytes / mucous-producing)
pre-B-cell leukemia homeobox 2
ZFIN
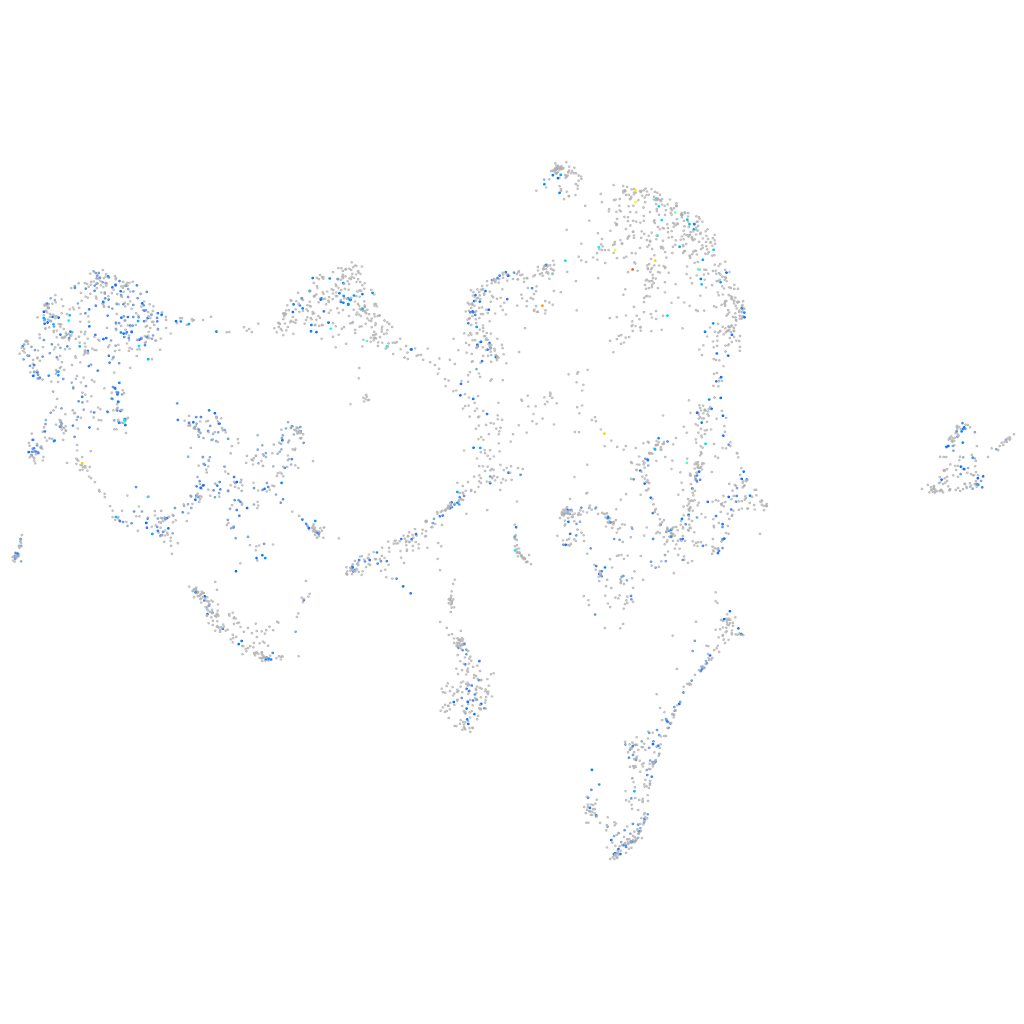
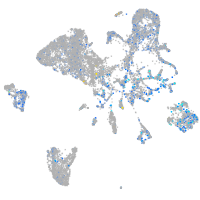
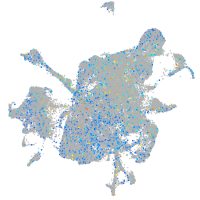
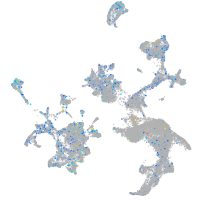
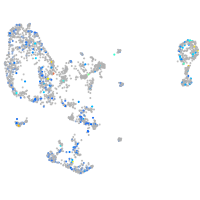
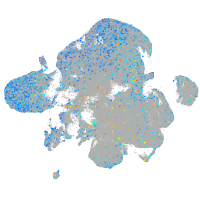
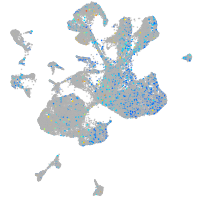
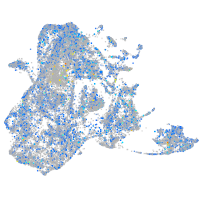
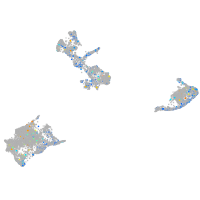
Gene expression UMAP
Display:
Expression
Stage
Other cell groups
all cells
blastomeres
PGCs
endoderm
axial mesoderm
muscle
mural cells /
non-skeletal muscle
mesenchyme
hematopoietic /
vasculature
pronephros
neural
spinal cord / glia
eye
taste / olfactory
otic / lateral line
epidermis
periderm
fin
ionocytes / mucous
pigment cells
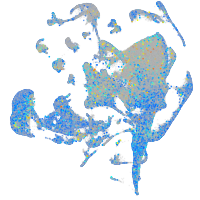
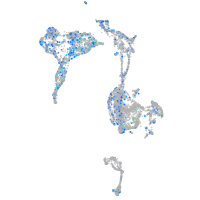
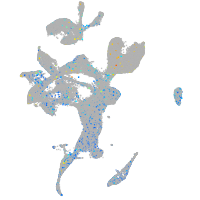
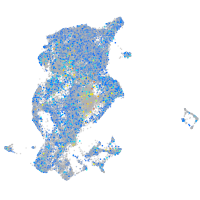
Expression by stage/cluster
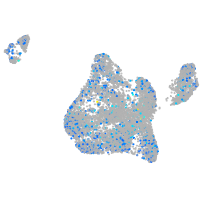
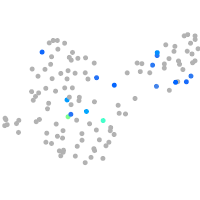
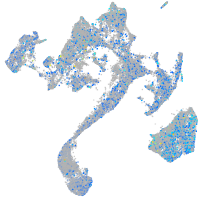
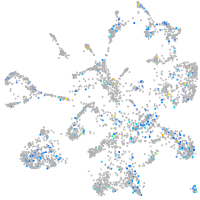
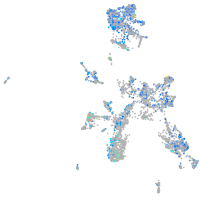
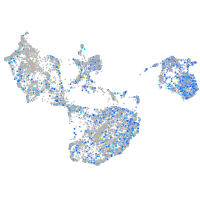
Correlated gene expression
Positive correlation
Negative correlation
Gene
r
Gene
r
si:ch1073-100f3.2
0.167
nectin1b
-0.058
LOC101882916
0.143
cadps2
-0.056
pnp5a
0.138
myof
-0.055
dsc2l
0.134
zgc:171686
-0.055
zgc:111983
0.134
mylz3
-0.055
si:dkeyp-51b9.3
0.132
fev
-0.054
znf1055
0.131
tent5bb
-0.053
BX000701.1
0.130
cdkn3
-0.052
si:ch211-207n23.2
0.128
zgc:158403
-0.050
LOC103909138
0.127
pdia5
-0.049
sgsm1a
0.127
scin
-0.048
elovl7b
0.125
cpda
-0.048
XLOC-031177
0.124
tp53inp2
-0.048
htr2cl2
0.123
tnnc2
-0.047
ponzr2
0.123
stard10
-0.047
tcnbb
0.122
prkag2a
-0.047
tmem176l.4
0.121
ptpn18
-0.044
si:ch73-52f15.5
0.121
magoh
-0.044
cast
0.120
TSTA3 (1 of many)
-0.043
scel
0.119
PQLC1
-0.042
mir733
0.119
drd4-rs
-0.041
CR381544.2
0.119
nansa
-0.041
si:ch211-125o16.4
0.118
ern2
-0.040
ido1
0.118
hyou1
-0.040
ubb
0.118
stt3a
-0.040
anxa1c
0.118
LOC100330864
-0.040
si:ch211-157c3.4
0.118
map3k10
-0.040
si:ch73-204p21.2
0.117
b3gnt7
-0.040
plekhf1
0.117
cldn8
-0.039
cyb5r2
0.117
rit1
-0.039
lye
0.117
nsl1
-0.039
XLOC-020101
0.116
CT990625.1
-0.038
zgc:163030
0.116
si:dkey-266m15.5
-0.038
XLOC-042263
0.115
gins3
-0.038
stard14
0.115
spdl1
-0.038