Daniocell
paqr5b (neural)
progestin and adipoQ receptor family member Vb
ZFIN
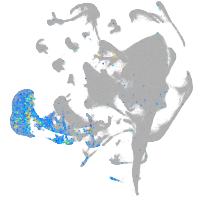
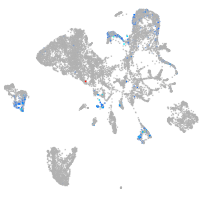
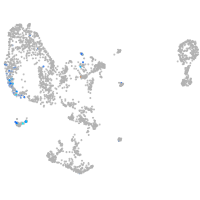
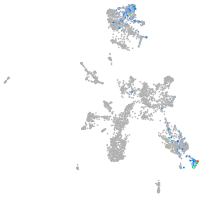
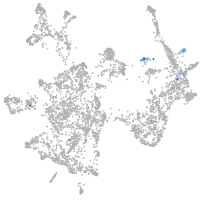
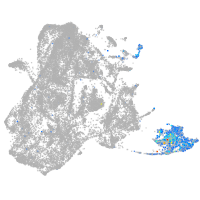
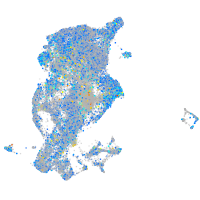
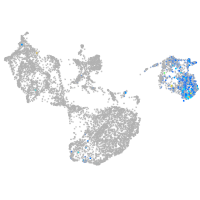
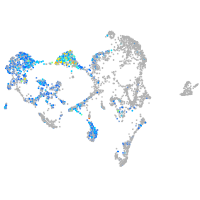
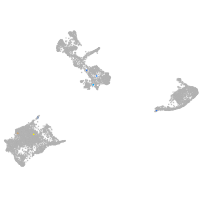
Gene expression UMAP
Display:
Expression
Stage
Other cell groups
all cells
blastomeres
PGCs
endoderm
axial mesoderm
muscle
mural cells /
non-skeletal muscle
mesenchyme
hematopoietic /
vasculature
pronephros
neural
spinal cord / glia
eye
taste / olfactory
otic / lateral line
epidermis
periderm
fin
ionocytes / mucous
pigment cells
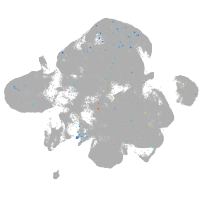
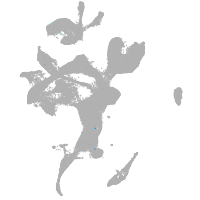
Expression by stage/cluster
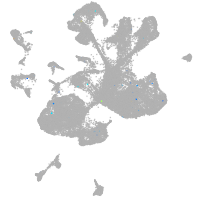
Correlated gene expression
Positive correlation
Negative correlation
Gene
r
Gene
r
si:ch211-113d11.6
0.127
hnrnpaba
-0.020
neu3.3
0.121
ptmab
-0.018
LOC103908636
0.117
hnrnpabb
-0.017
zanl
0.108
hmgn7
-0.017
ace2
0.107
si:ch211-222l21.1
-0.016
plac8.1
0.101
si:ch73-1a9.3
-0.016
vil1
0.101
h2afvb
-0.016
zgc:112146
0.099
tubb2b
-0.016
CT573429.1
0.097
rbm8a
-0.015
zgc:172079
0.097
hmgn6
-0.014
si:ch211-196f2.3
0.097
syncrip
-0.014
LOC110438125
0.097
cirbpa
-0.014
cyp3a65
0.096
fkbp1aa
-0.014
zgc:158846
0.093
setb
-0.014
stoml3b
0.093
khdrbs1a
-0.013
chs1
0.092
ilf3b
-0.013
apoa4b.2
0.090
marcksl1b
-0.013
abcc2
0.090
pfdn4
-0.013
entpd8
0.089
h3f3d
-0.012
ugt1a7
0.089
snrpg
-0.012
myo7bb
0.088
si:ch211-51e12.7
-0.012
si:ch211-142d6.2
0.087
sub1a
-0.012
tm4sf4
0.086
rbbp4
-0.012
slc6a19a.2
0.086
snrpf
-0.012
tmem176l.2
0.086
tuba8l4
-0.012
tcnba
0.085
tuba1c
-0.011
tm4sf5
0.084
hmgb1b
-0.011
gpr39
0.084
snrpc
-0.011
eps8l3b
0.084
cbx3a
-0.011
si:ch211-198m17.1
0.083
si:ch211-288g17.3
-0.011
XLOC-027304
0.082
smarce1
-0.011
cldn15la
0.081
snrpd2
-0.011
sult1st3
0.080
hmga1a
-0.011
BX908782.3
0.079
tma7
-0.011
zgc:77748
0.079
ccdc12
-0.011