
"platelet-activating factor acetylhydrolase 1b, regulatory subunit 1a"
ZFIN 
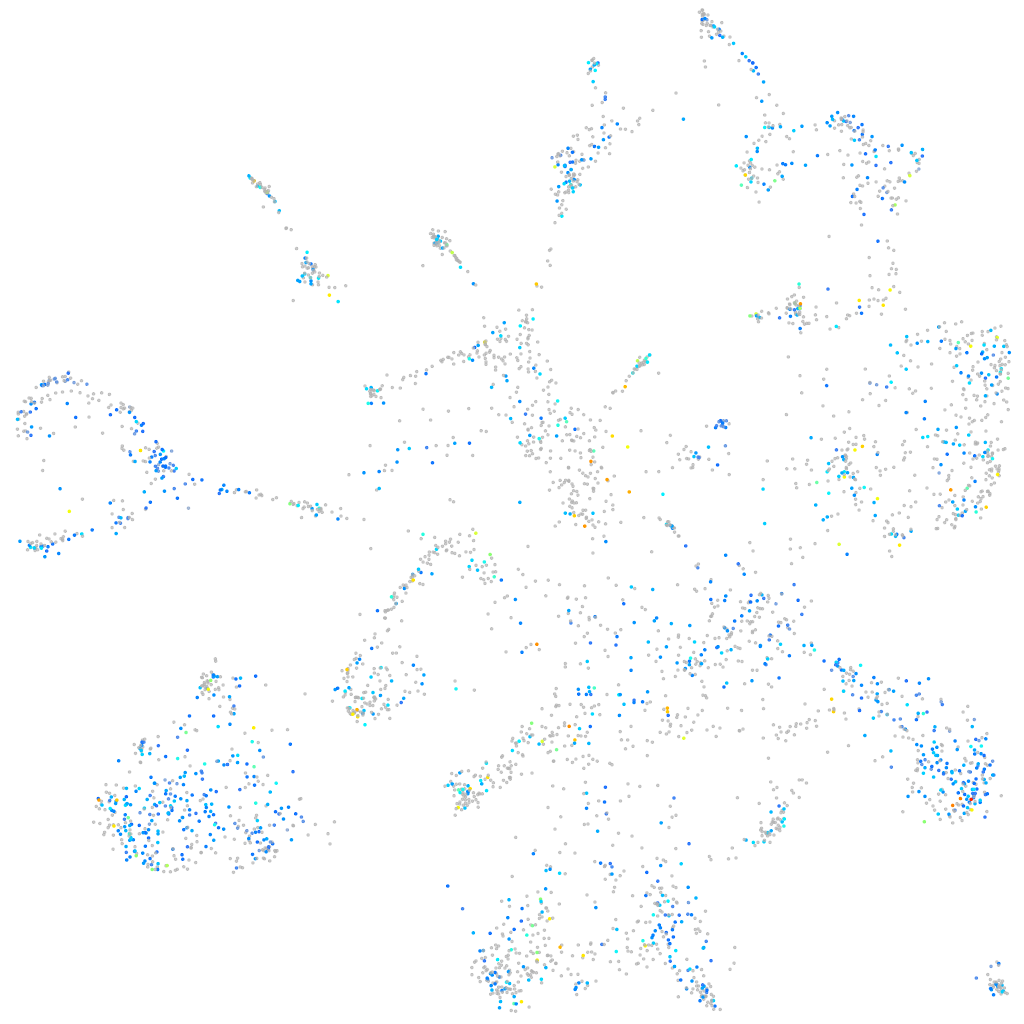
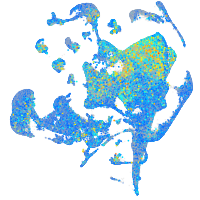
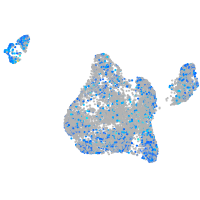
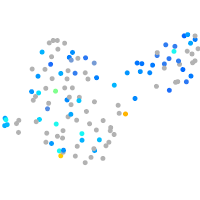
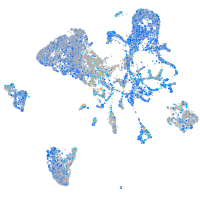
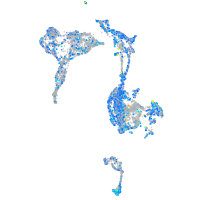
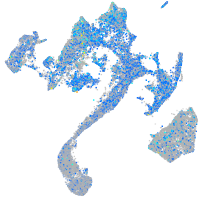
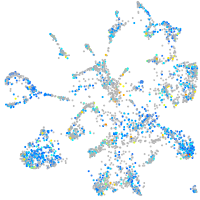
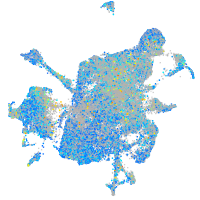
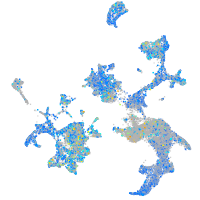
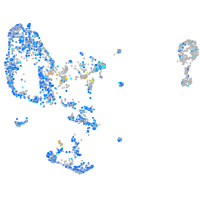
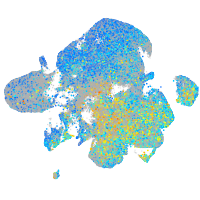
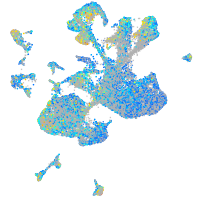
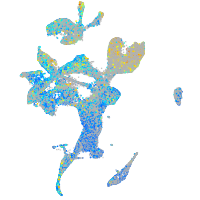
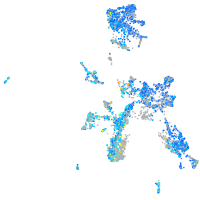
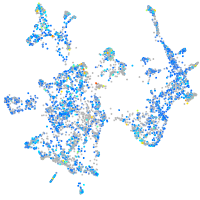
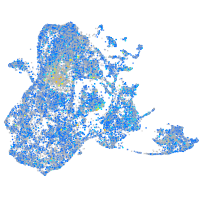
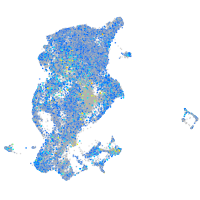
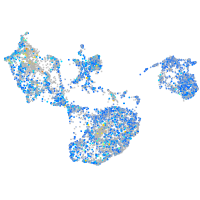
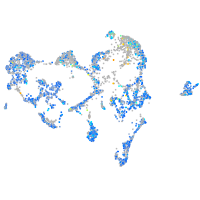
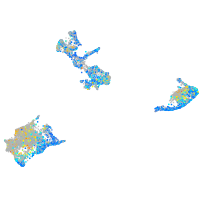
Gene expression UMAP


Expression by stage/cluster
Correlated gene expression
| Positive correlation | Negative correlation | ||
| Gene | r | Gene | r |
| h2afvb | 0.140 | ifitm1 | -0.077 |
| tubb2b | 0.135 | rps29 | -0.070 |
| nova1 | 0.127 | prss1 | -0.070 |
| si:ch211-288g17.3 | 0.123 | hey1 | -0.057 |
| ppp1r14ba | 0.121 | ctrb1 | -0.051 |
| hmgb1b | 0.118 | ttn.2 | -0.050 |
| tuba1c | 0.117 | map3k15 | -0.050 |
| tubb5 | 0.115 | CELA1 (1 of many) | -0.049 |
| ptmab | 0.115 | pvalb2 | -0.049 |
| hnrnpaba | 0.114 | pvalb1 | -0.049 |
| tpx2 | 0.114 | bgnb | -0.047 |
| h3f3a | 0.114 | cebpd | -0.047 |
| hmgb1a | 0.114 | rho | -0.047 |
| rbm8a | 0.112 | sqstm1 | -0.046 |
| stmn1b | 0.112 | rbp4 | -0.046 |
| hmgn2 | 0.111 | sycn.2 | -0.044 |
| h3f3d | 0.110 | olfml2a | -0.043 |
| ywhaba | 0.109 | slc7a1 | -0.042 |
| psma3 | 0.109 | lama4 | -0.042 |
| marcksb | 0.109 | cox7a1 | -0.042 |
| si:ch211-51e12.7 | 0.108 | mylpfa | -0.042 |
| hdac1 | 0.108 | ints6 | -0.042 |
| sncb | 0.107 | plxnb2a | -0.041 |
| map1aa | 0.106 | optn | -0.041 |
| idh2 | 0.106 | myhz1.2 | -0.040 |
| tuba8l | 0.106 | filip1b | -0.040 |
| ywhag2 | 0.105 | pros1 | -0.040 |
| ccna2 | 0.105 | prss59.2 | -0.040 |
| h2afva | 0.105 | crygmx | -0.039 |
| dscamb | 0.104 | tpma | -0.039 |
| sem1 | 0.104 | rgs5a | -0.038 |
| plk1 | 0.103 | cpb1 | -0.038 |
| syk | 0.103 | nr1d1 | -0.038 |
| psmb6 | 0.103 | smyhc1 | -0.037 |
| si:ch73-281n10.2 | 0.103 | trim105 | -0.037 |