Daniocell
osgin2 (hematopoietic / vasculature)
oxidative stress induced growth inhibitor family member 2
ZFIN
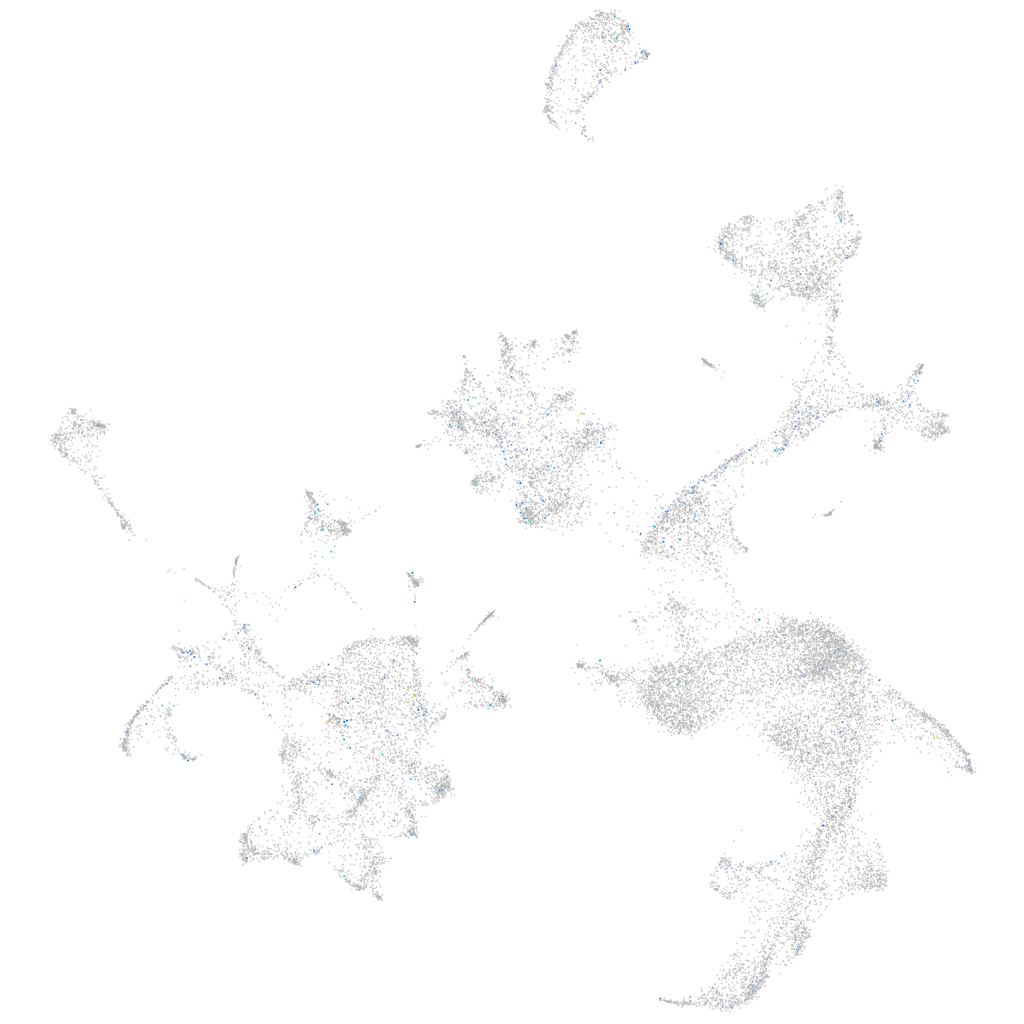
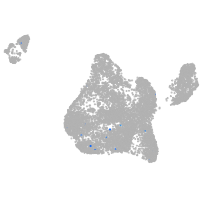
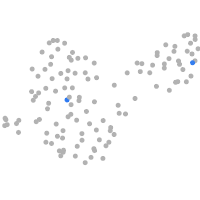
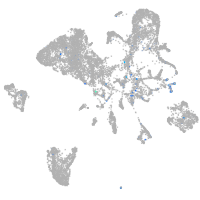
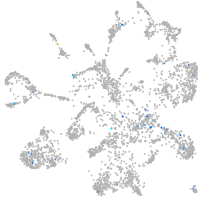
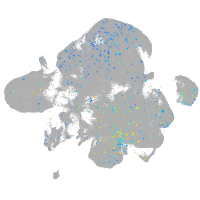
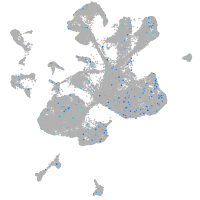
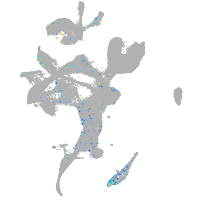
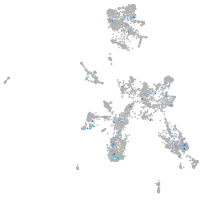
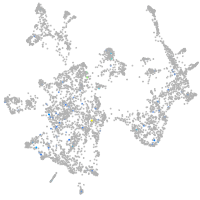
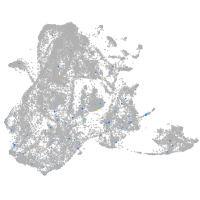
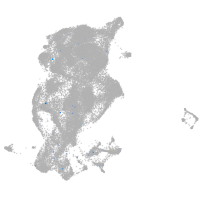
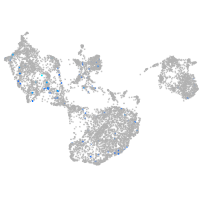
Gene expression UMAP
Display:
Expression
Stage
Other cell groups
all cells
blastomeres
PGCs
endoderm
axial mesoderm
muscle
mural cells /
non-skeletal muscle
mesenchyme
hematopoietic /
vasculature
pronephros
neural
spinal cord / glia
eye
taste / olfactory
otic / lateral line
epidermis
periderm
fin
ionocytes / mucous
pigment cells
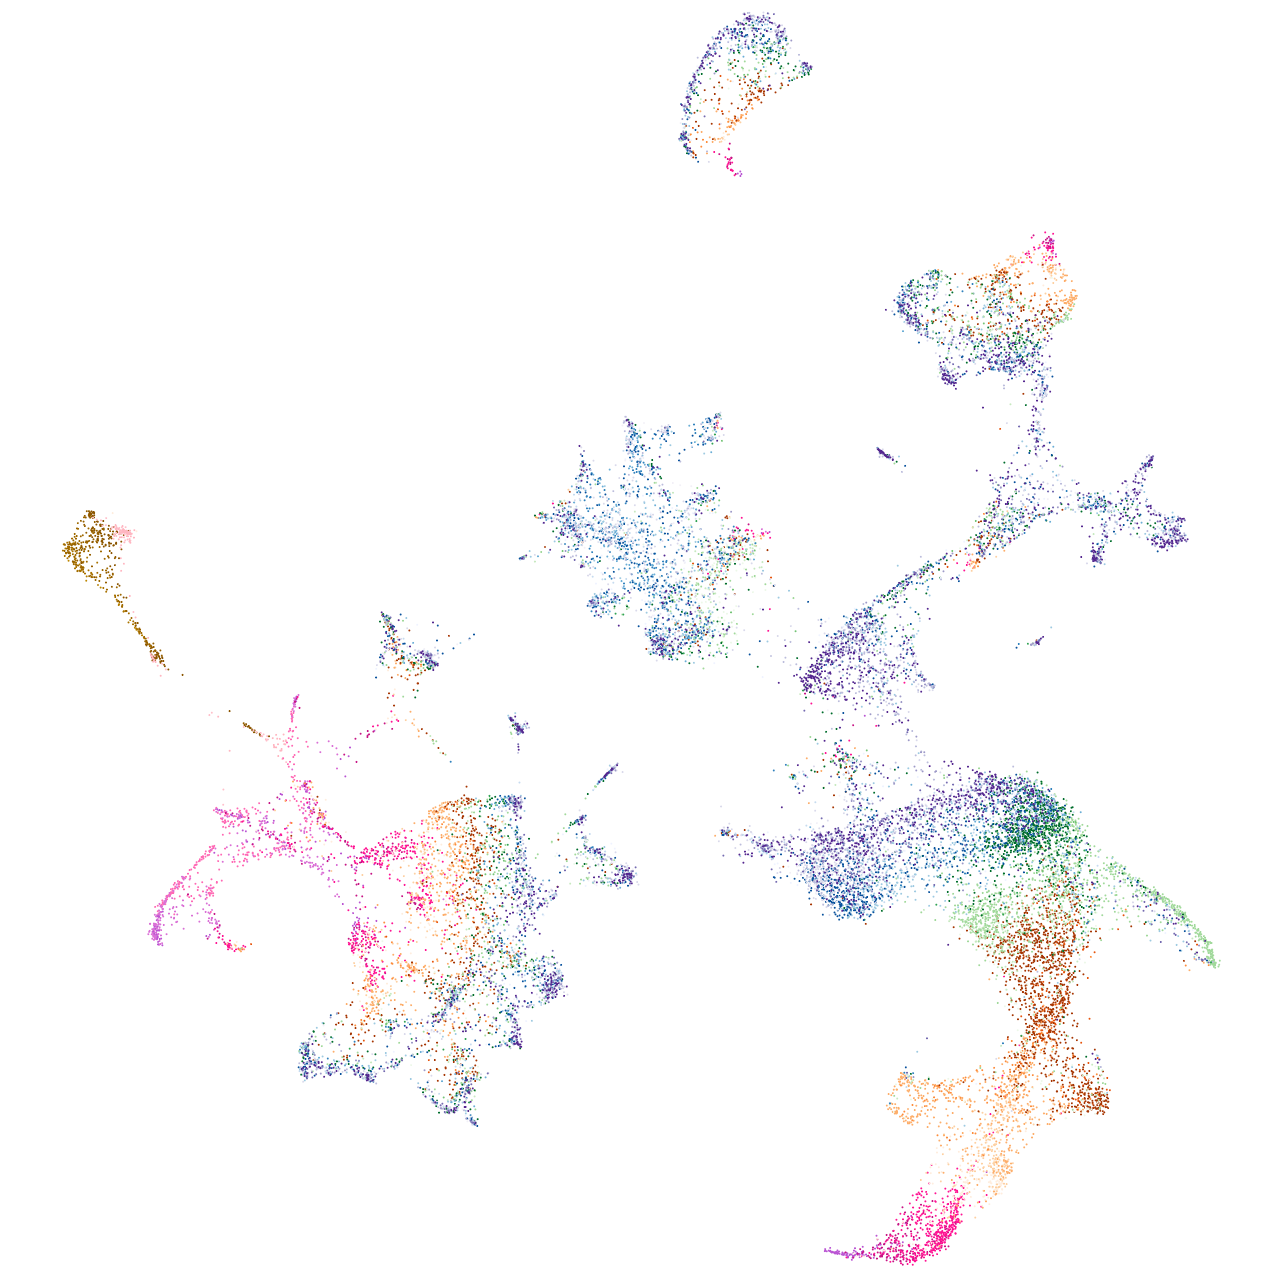
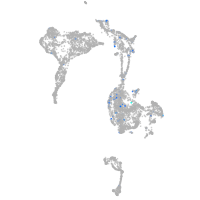
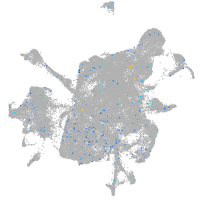
Expression by stage/cluster
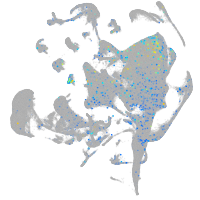
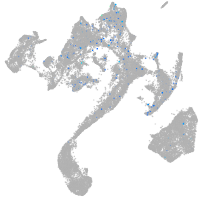
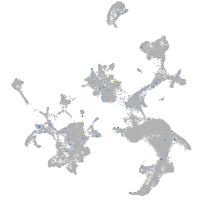
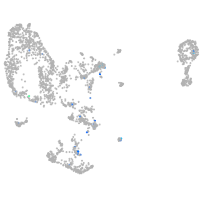
Correlated gene expression
Positive correlation
Negative correlation
Gene
r
Gene
r
si:ch211-285c6.2
0.166
hbbe2
-0.035
BX511124.1
0.124
hbae3
-0.035
LOC103909138
0.123
hbae1.3
-0.032
si:ch211-142b24.2
0.105
cahz
-0.032
acot16
0.101
hbbe1.1
-0.032
upk3b
0.092
hbbe1.3
-0.031
fam196ab
0.088
hemgn
-0.030
ccdc33
0.085
hbae1.1
-0.030
CR388378.1
0.083
creg1
-0.029
CR848742.1
0.082
plac8l1
-0.028
hoxb4a
0.081
si:ch211-207c6.2
-0.028
pimr191
0.080
alas2
-0.027
ush1gb
0.079
si:ch211-250g4.3
-0.027
LO017849.1
0.078
nt5c2l1
-0.026
BX004780.1
0.077
zgc:163057
-0.025
pcdh2g5
0.076
hbbe1.2
-0.025
LOC110438793
0.075
tmod4
-0.023
si:ch211-197g15.10
0.075
selenoj
-0.023
lrrc7
0.072
si:dkey-240n22.3
-0.023
or126-7
0.071
histh1l
-0.023
si:ch211-219a15.3
0.071
pvalb1
-0.022
XLOC-042662
0.071
blvrb
-0.022
CU633999.1
0.069
LOC108179634
-0.021
ggact.2
0.069
tspo
-0.020
CR854927.2
0.068
tbcelb
-0.020
XLOC-043211
0.068
CR293511.1
-0.020
CU137680.1
0.067
mt2
-0.020
si:dkey-19a16.16
0.066
gp9
-0.020
LOC101886880
0.066
hif1al2
-0.020
itga2.1
0.065
gpx1a
-0.020
CABZ01112732.1
0.064
fth1a
-0.019
si:dkeyp-72e1.6
0.064
nt5e
-0.019
gja8b
0.064
eef2l2
-0.019
LOC110439728
0.064
mterf3
-0.019
si:ch211-59p23.1
0.063
add2
-0.019