Daniocell
orai1a (glial cells / spinal cord)
ORAI calcium release-activated calcium modulator 1a
ZFIN
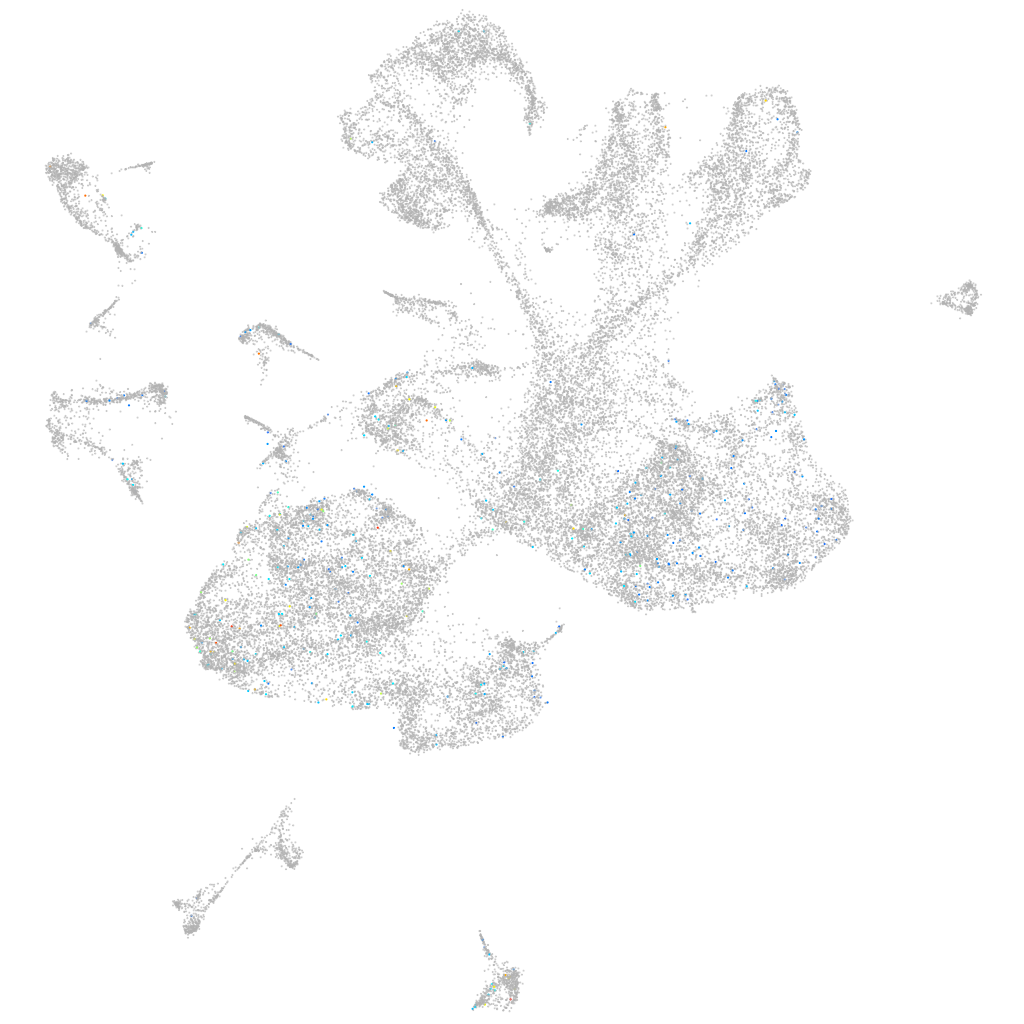
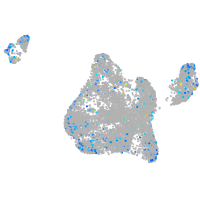
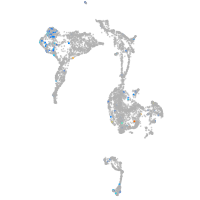
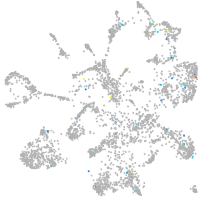
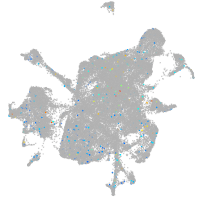
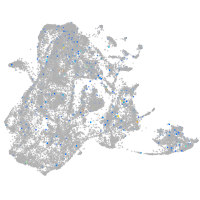
Gene expression UMAP
Display:
Expression
Stage
Other cell groups
all cells
blastomeres
PGCs
endoderm
axial mesoderm
muscle
mural cells /
non-skeletal muscle
mesenchyme
hematopoietic /
vasculature
pronephros
neural
spinal cord / glia
eye
taste / olfactory
otic / lateral line
epidermis
periderm
fin
ionocytes / mucous
pigment cells
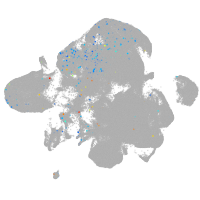
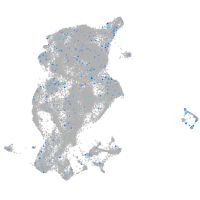
Expression by stage/cluster
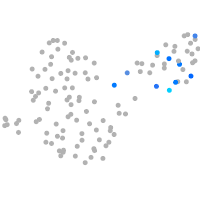
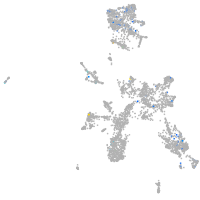
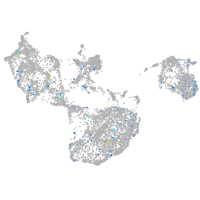
Correlated gene expression
Positive correlation
Negative correlation
Gene
r
Gene
r
P2RY14
0.106
elavl3
-0.055
si:busm1-71b9.3
0.099
myt1b
-0.047
XLOC-043261
0.088
h3f3d
-0.043
si:ch211-69e13.6
0.086
ptmab
-0.041
mmp25a
0.084
jpt1b
-0.038
CU467042.1
0.081
tmsb
-0.037
LOC101885014
0.076
zc4h2
-0.036
BX088603.1
0.073
hmgn6
-0.036
znf1038
0.073
LOC100537384
-0.035
si:ch211-76l23.7
0.073
gng3
-0.035
rs1b
0.073
hmgb3a
-0.035
CR626882.3
0.072
myt1a
-0.035
cdhr1a
0.070
si:ch211-222l21.1
-0.035
XLOC-013344
0.068
zfhx3
-0.035
prss60.3
0.066
pik3r3b
-0.035
XLOC-028682
0.066
jagn1a
-0.034
BX088540.1
0.061
elavl4
-0.034
CABZ01046996.1
0.059
stx1b
-0.034
XLOC-004546
0.058
stxbp1a
-0.034
XLOC-027304
0.058
cirbpb
-0.033
fabp7a
0.058
stmn1b
-0.033
LOC100535130
0.057
gng2
-0.033
LOC100534786
0.056
ptmaa
-0.032
si:ch211-66e2.5
0.054
sncb
-0.032
slc1a3b
0.053
tmeff1b
-0.032
si:ch211-223g7.2
0.053
scrt2
-0.032
ppap2d
0.053
atcaya
-0.032
cyp8b3
0.053
tubb5
-0.032
sox2
0.053
zgc:100920
-0.031
glula
0.052
sox11b
-0.030
LOC110437765
0.051
hnrnpaba
-0.030
atp1a1b
0.051
rbfox2
-0.030
LOC100537733
0.050
si:dkey-56m19.5
-0.030
id1
0.050
si:ch73-386h18.1
-0.030
CR626941.1
0.050
ube2e3
-0.030