Daniocell
ntan1 (mural cells / non-skeletal muscle)
N-terminal asparagine amidase
ZFIN
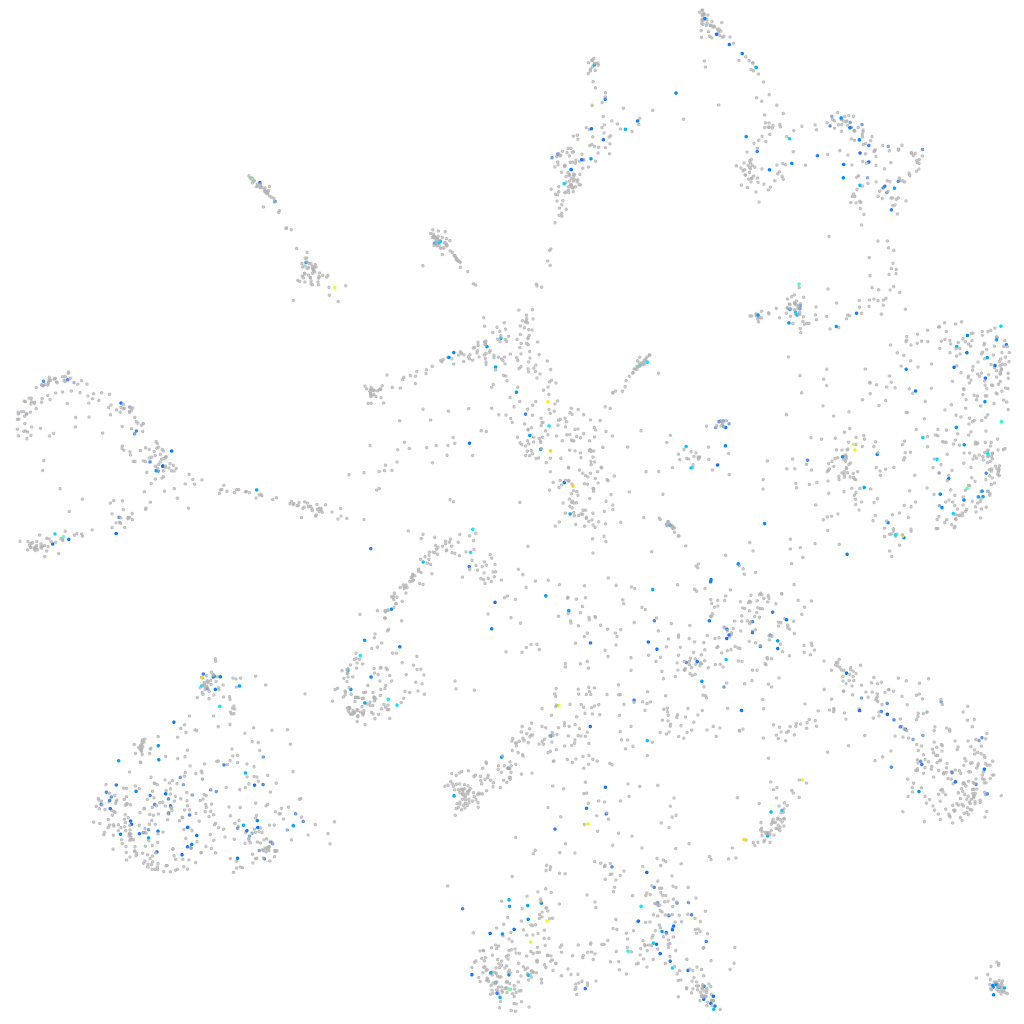
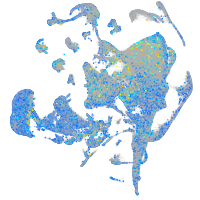
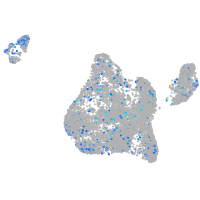
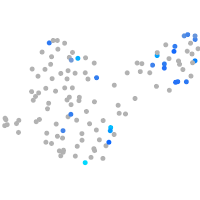
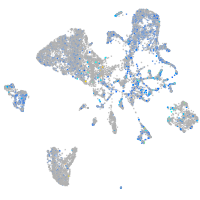
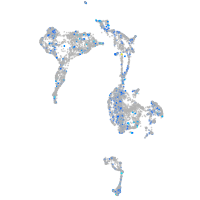
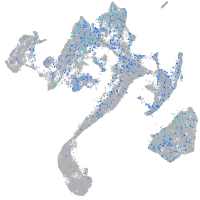
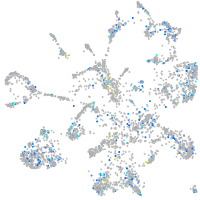
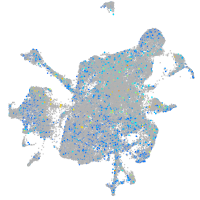
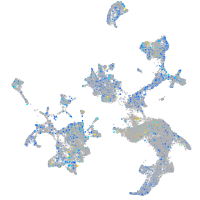
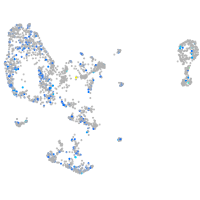
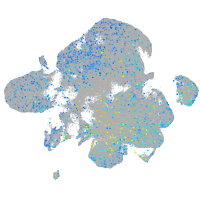
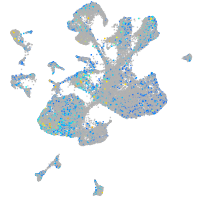
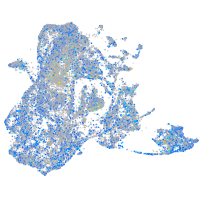
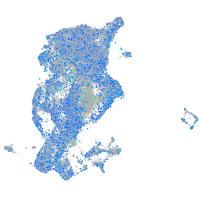
Gene expression UMAP
Display:
Expression
Stage
Other cell groups
all cells
blastomeres
PGCs
endoderm
axial mesoderm
muscle
mural cells /
non-skeletal muscle
mesenchyme
hematopoietic /
vasculature
pronephros
neural
spinal cord / glia
eye
taste / olfactory
otic / lateral line
epidermis
periderm
fin
ionocytes / mucous
pigment cells
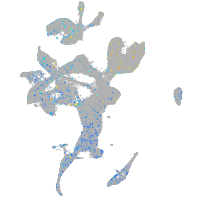
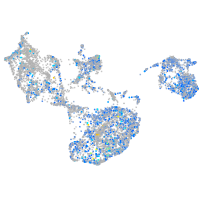
Expression by stage/cluster
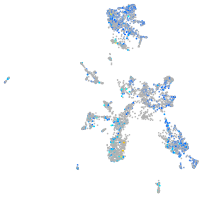
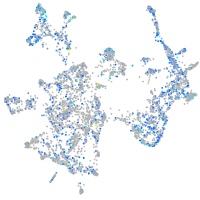
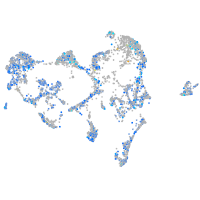
Correlated gene expression
Positive correlation
Negative correlation
Gene
r
Gene
r
si:dkey-27p18.3
0.119
tnnt3b
-0.049
mlana
0.112
wfdc2
-0.041
LOC101884310
0.112
mki67
-0.039
eif3bb
0.110
chl1b
-0.038
XLOC-009562
0.108
leo1
-0.038
si:dkeyp-85e10.3
0.105
ube2c
-0.038
si:ch73-22a13.3
0.105
hbae1.1
-0.037
XLOC-011600
0.104
mid1ip1l
-0.037
rtn4rl2b
0.102
kif23
-0.037
BX511034.3
0.102
rgma
-0.036
FP245456.1
0.100
slc2a1b
-0.036
si:dkey-253i9.4
0.099
pvalb2
-0.036
si:dkey-152b24.6
0.098
mfhas1
-0.036
si:dkey-30c15.13
0.097
XLOC-014397
-0.035
CABZ01041494.1
0.092
CR855257.1
-0.035
serpinb1l1
0.092
CT868708.1
-0.034
si:ch73-378g22.1
0.092
cenpf
-0.034
tbxta
0.092
wnt11r
-0.034
LOC100535985
0.090
LOC101884949
-0.034
wnt9b
0.090
si:dkey-17o15.2
-0.033
col10a1a
0.090
si:ch73-217n20.1
-0.033
LOC108181107
0.088
bgna
-0.033
cbln10
0.088
rims2b
-0.033
echdc1
0.087
atp2a1
-0.032
alas1
0.087
kif11
-0.032
emx1
0.087
cdc20
-0.032
si:ch211-172l8.4
0.087
zgc:194627
-0.032
il17ra1a
0.086
exosc9
-0.032
BX649398.2
0.086
pitpnc1b
-0.031
AL954741.1
0.086
actn3b
-0.031
btr04
0.084
tmem246
-0.031
LOC108181171
0.082
srd5a3
-0.031
si:dkey-4j21.2
0.082
ercc3
-0.031
med7
0.082
pttg1
-0.031
zgc:152670
0.081
cdc14b
-0.031