Daniocell
nsun3 (muscle)
NOP2/Sun RNA methyltransferase 3
ZFIN
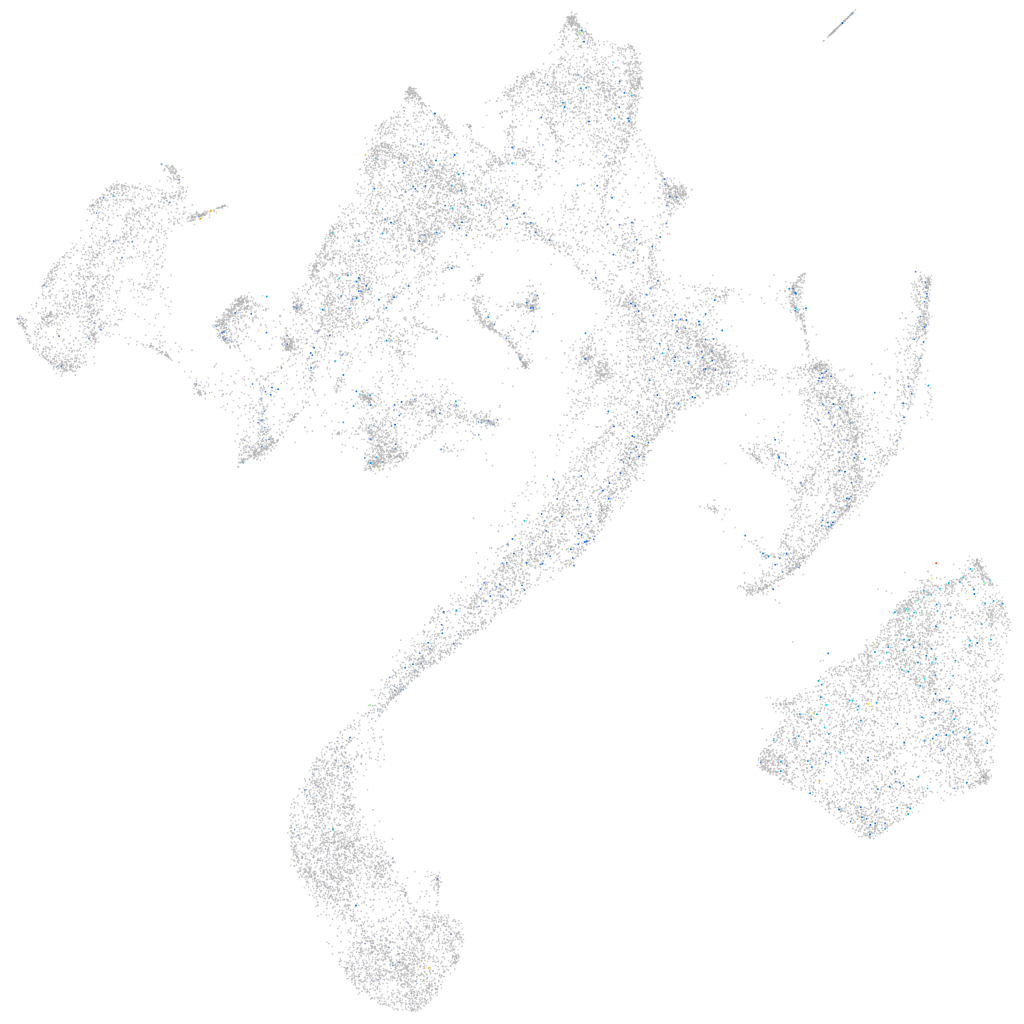
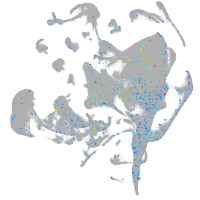
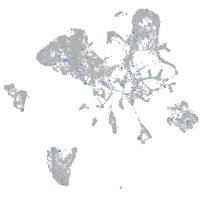
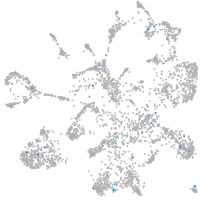
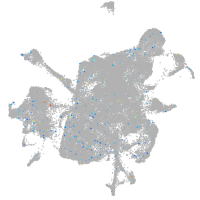
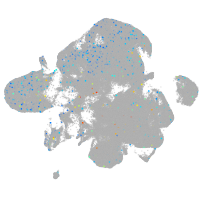
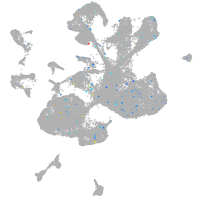
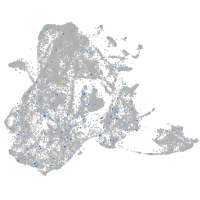
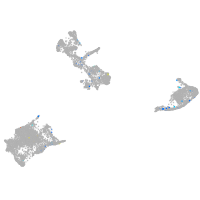
Gene expression UMAP
Display:
Expression
Stage
Other cell groups
all cells
blastomeres
PGCs
endoderm
axial mesoderm
muscle
mural cells /
non-skeletal muscle
mesenchyme
hematopoietic /
vasculature
pronephros
neural
spinal cord / glia
eye
taste / olfactory
otic / lateral line
epidermis
periderm
fin
ionocytes / mucous
pigment cells
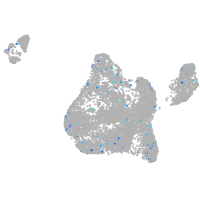
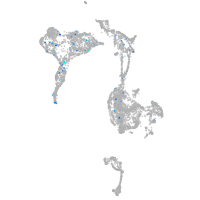
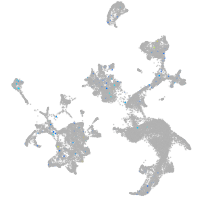
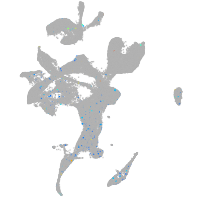
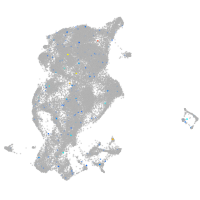
Expression by stage/cluster
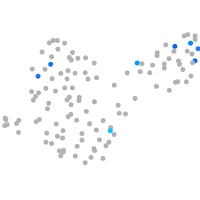
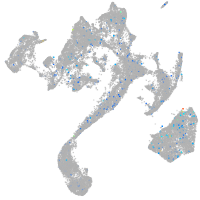
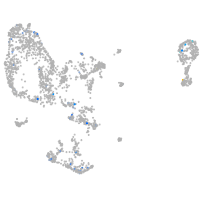
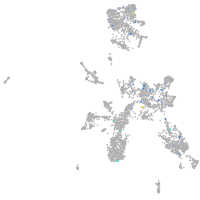
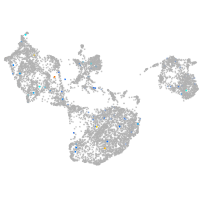
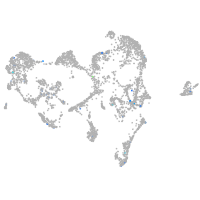
Correlated gene expression
Positive correlation
Negative correlation
Gene
r
Gene
r
CR790382.3
0.090
rpl37
-0.039
CABZ01072084.1
0.087
pvalb1
-0.037
si:dkey-45h7.1
0.084
nme2b.2
-0.034
cngb3.1
0.083
pvalb2
-0.034
si:dkey-95p16.1
0.079
si:dkey-16p21.8
-0.034
CR931802.3
0.078
rps10
-0.034
LOC103908802
0.073
si:ch211-255p10.3
-0.034
BX571724.2
0.069
zgc:114188
-0.034
LOC101886593
0.065
eno3
-0.033
si:ch73-362m14.2
0.065
rps17
-0.032
sts
0.065
actn3a
-0.032
GPR151
0.062
neb
-0.032
GPR62
0.061
XLOC-025819
-0.032
CR759810.1
0.058
actc1b
-0.032
pimr81
0.057
XLOC-006515
-0.032
tacr3l
0.057
pkmb
-0.032
RF00409
0.057
casq1b
-0.032
BX005068.1
0.056
ckma
-0.032
zgc:112148
0.056
si:ch73-367p23.2
-0.031
im:7140347
0.056
si:ch211-266g18.10
-0.031
LOC562245
0.054
pgam2
-0.031
ppp2cb
0.054
actn3b
-0.031
LOC110438783
0.053
XLOC-001975
-0.030
CR589944.2
0.052
si:dkey-211f22.5
-0.030
syt18b
0.051
ckmb
-0.030
ecm1a
0.051
smyd1a
-0.030
abcf1
0.051
jph2
-0.030
CR388228.1
0.050
ckmt2b
-0.030
eif4bb
0.050
atp2a1
-0.030
LOC100534659
0.050
tnnt3b
-0.030
LOC101882570
0.049
pmp22b
-0.029
LOC100331508
0.049
xirp2b
-0.029
LOC110438396
0.049
ttn.2
-0.029
fbl
0.049
tnni2a.4
-0.029
crp6
0.049
myom1a
-0.029