Daniocell
npm1b (blastomeres)
nucleophosmin 1b
ZFIN
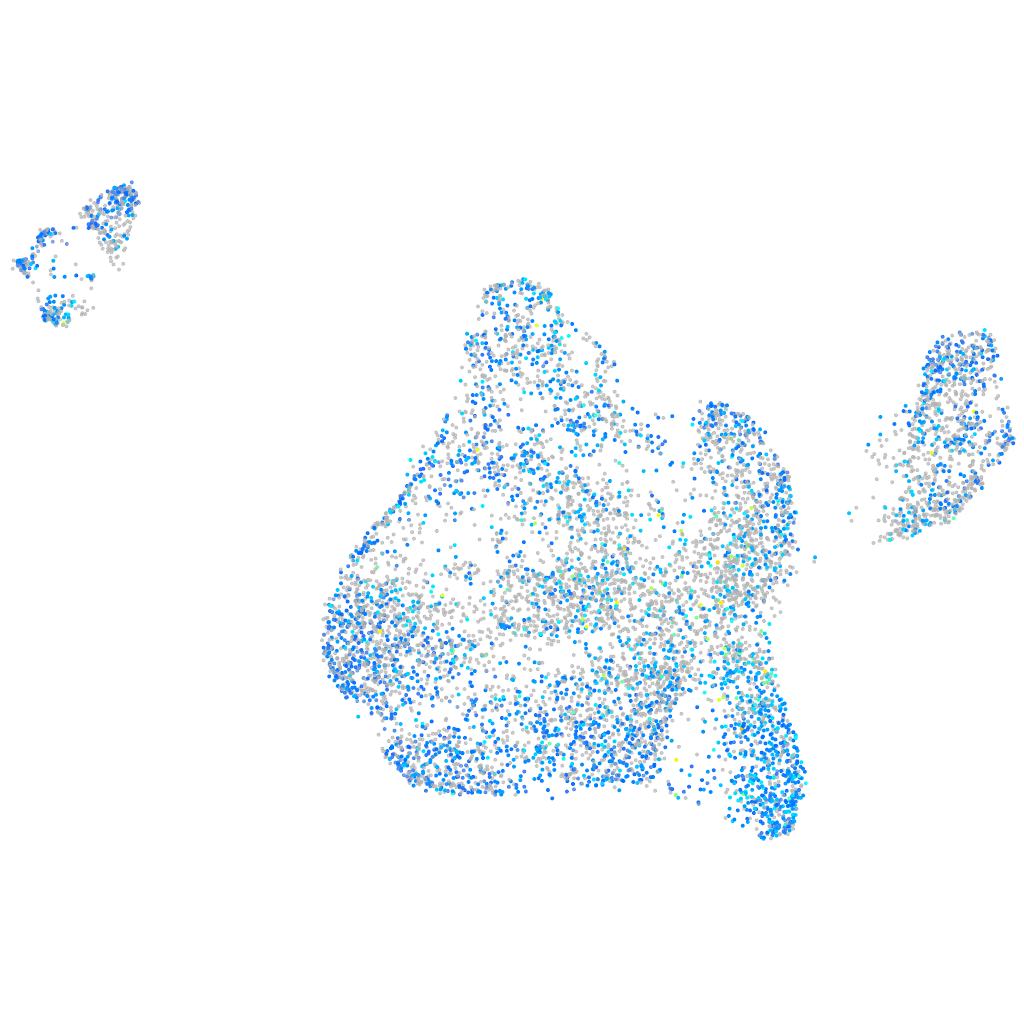
Gene expression UMAP
Display:
Expression
Stage
Other cell groups
all cells
blastomeres
PGCs
endoderm
axial mesoderm
muscle
mural cells /
non-skeletal muscle
mesenchyme
hematopoietic /
vasculature
pronephros
neural
spinal cord / glia
eye
taste / olfactory
otic / lateral line
epidermis
periderm
fin
ionocytes / mucous
pigment cells
Expression by stage/cluster
Correlated gene expression
Positive correlation
Negative correlation
Gene
r
Gene
r
si:dkey-108k21.10
0.137
NC-002333.4
-0.086
si:ch211-113a14.18
0.129
mt-cyb
-0.084
ctcf
0.110
COX3
-0.052
zgc:110425
0.109
actb1
-0.049
tprb
0.109
mt-co2
-0.046
nucks1a
0.108
h2afx
-0.044
akap12b
0.105
gale
-0.039
si:ch73-347e22.4
0.105
tdh
-0.035
zgc:153405
0.103
h3f3d
-0.035
mki67
0.103
slc25a19
-0.034
zgc:110216
0.103
si:dkey-251i10.2
-0.033
ncl
0.102
ska2
-0.033
hnrnpua
0.099
hmgb1b
-0.033
si:dkey-261m9.12
0.097
cd9b
-0.032
si:ch211-160o17.4
0.097
pttg1
-0.032
hnrnpub
0.097
vox
-0.032
hsp90ab1
0.095
BX511067.1
-0.031
rprd1a
0.091
hmgcs1
-0.031
supt6h
0.091
bco2a
-0.030
si:ch211-113a14.24
0.090
si:ch211-107e6.5
-0.030
si:dkey-23a13.17
0.089
ucp2
-0.030
hsp90aa1.2
0.089
BX927193.2
-0.030
si:ch1073-153i20.4
0.089
klf17
-0.029
smarcd1
0.088
XLOC-033809
-0.029
pnrc2
0.088
ric8b
-0.028
aspm
0.088
si:dkey-261j4.3
-0.028
mgaa
0.087
zgc:113208
-0.028
si:dkey-108k21.14
0.087
bcar1
-0.028
sec62
0.087
si:dkey-83k24.5
-0.028
hcfc1a
0.086
si:ch211-284f22.3
-0.027
srrm1
0.086
CT573476.1
-0.027
si:ch211-212k18.4
0.086
stard3
-0.027
dido1
0.085
mid1ip1a
-0.027
srp14
0.084
klf2a
-0.027
mad1l1
0.084
si:ch73-308l14.2
-0.027