Daniocell
nme6 (blastomeres)
NME/NM23 nucleoside diphosphate kinase 6
ZFIN
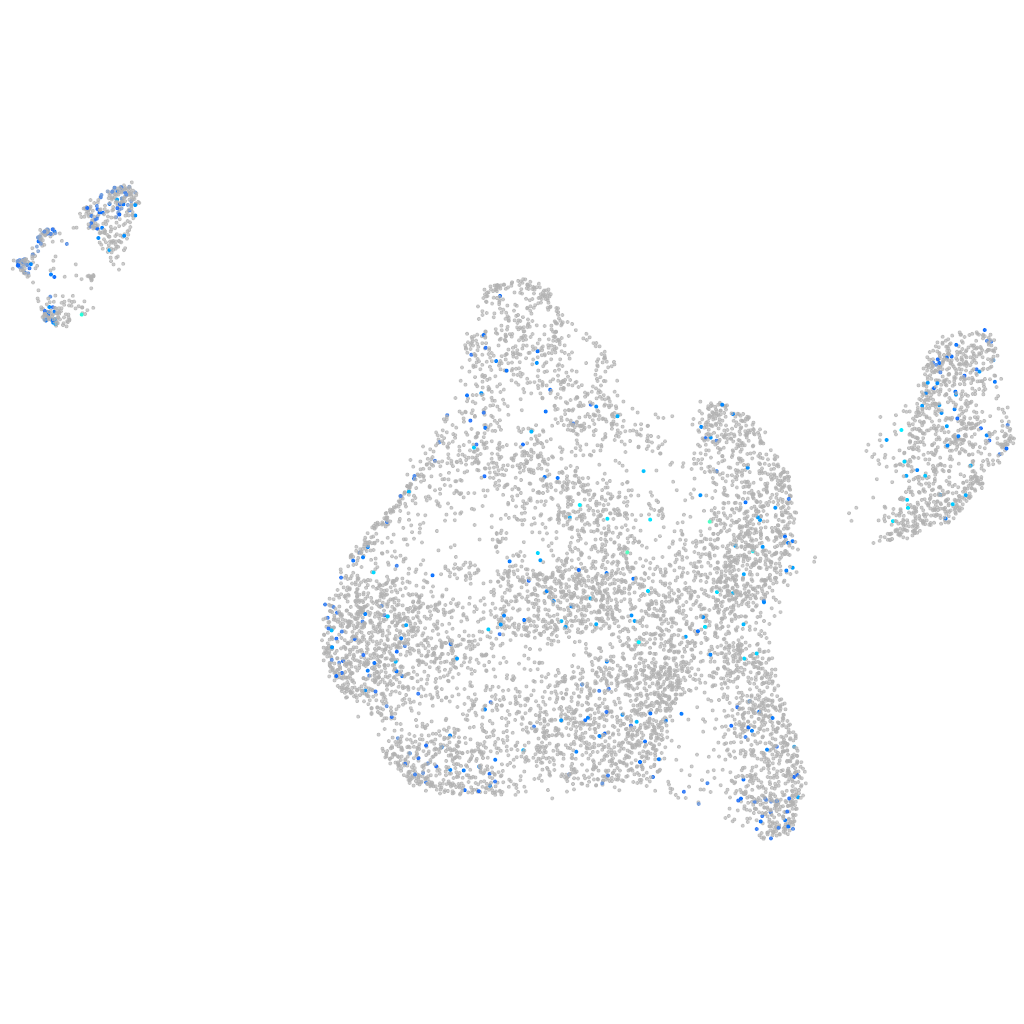
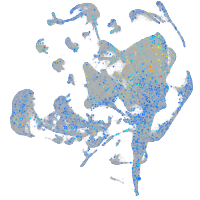
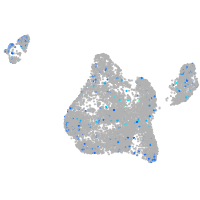
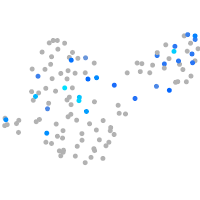
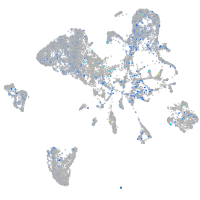
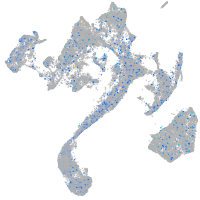
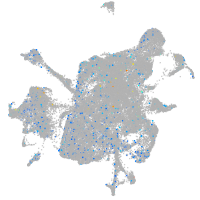
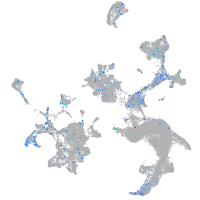
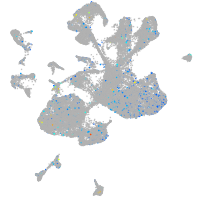
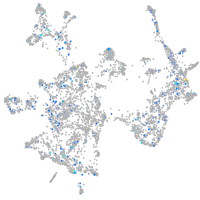
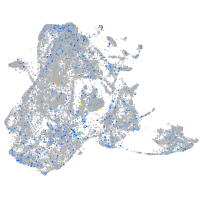
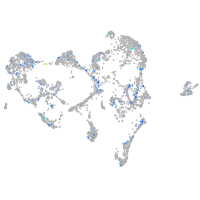
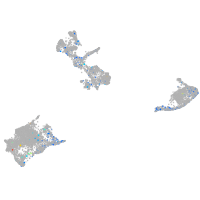
Gene expression UMAP
Display:
Expression
Stage
Other cell groups
all cells
blastomeres
PGCs
endoderm
axial mesoderm
muscle
mural cells /
non-skeletal muscle
mesenchyme
hematopoietic /
vasculature
pronephros
neural
spinal cord / glia
eye
taste / olfactory
otic / lateral line
epidermis
periderm
fin
ionocytes / mucous
pigment cells
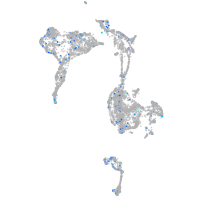
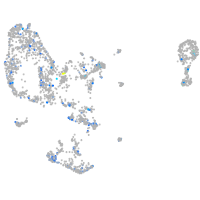
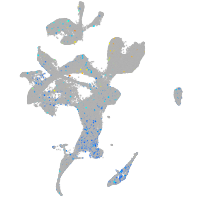
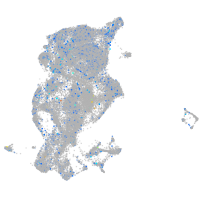
Expression by stage/cluster
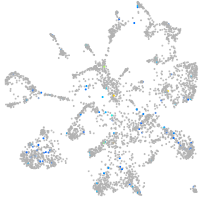
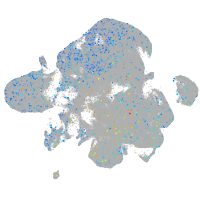
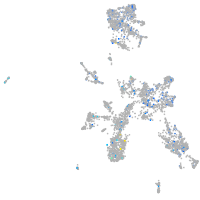
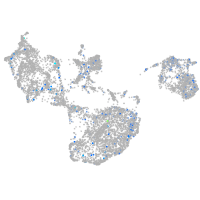
Correlated gene expression
Positive correlation
Negative correlation
Gene
r
Gene
r
btg4
0.123
marcksl1b
-0.104
h2af1al
0.108
si:ch73-1a9.3
-0.103
yipf1
0.106
stm
-0.101
cldnd
0.104
polr3gla
-0.099
cldng
0.104
hspb1
-0.098
mknk2a
0.104
dynll1
-0.096
si:dkeyp-72e1.7
0.103
rplp1
-0.094
CR759955.1
0.102
hnrnpa0b
-0.094
krtcap2
0.102
hmga1a
-0.091
acp5a
0.101
si:ch211-222l21.1
-0.089
zgc:113424
0.099
aldob
-0.085
mid1ip1l
0.098
hmgn6
-0.085
tent5c
0.097
si:dkey-151g10.6
-0.083
fbxo32
0.096
hmgb2a
-0.080
slbp2
0.096
eef1a1l1
-0.078
mmp16b
0.095
ptmab
-0.078
sinup
0.093
si:ch211-152c2.3
-0.075
pik3r3b
0.092
rps12
-0.075
tob1a
0.092
rps26l
-0.074
ska2
0.092
hmgn2
-0.074
zgc:162879
0.091
si:dkey-56m19.5
-0.074
vps9d1
0.090
rpl26
-0.072
LOC103910988
0.090
cirbpb
-0.072
ccnb2
0.090
ybx1
-0.070
mapre1a
0.089
rpl36
-0.070
si:ch211-226h7.5
0.089
rpl30
-0.069
si:ch211-147a11.3
0.089
srsf5a
-0.069
gtf3ab
0.089
anp32e
-0.069
spink2.1
0.089
rps15a
-0.068
buc
0.089
rps21
-0.067
si:ch211-132b12.8
0.089
khdrbs1a
-0.066
ccna1
0.088
rps2
-0.066
si:ch211-266i6.3
0.088
anp32b
-0.066
fam114a2
0.088
rps19
-0.065
CABZ01069022.2
0.087
akap12b
-0.064