Daniocell
nhsa (periderm)
Nance-Horan syndrome a (congenital cataracts and dental anomalies)
ZFIN
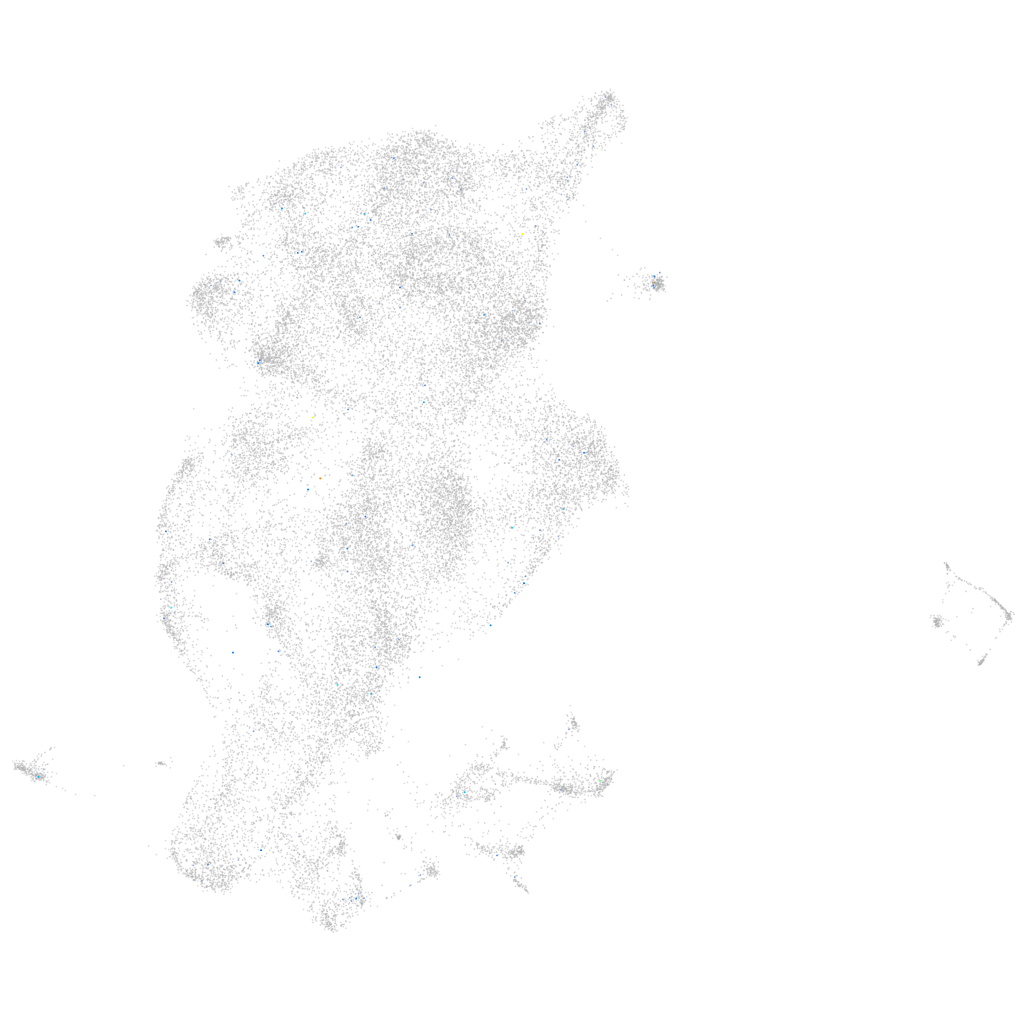
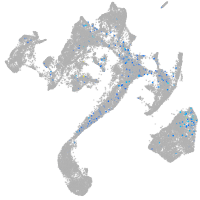
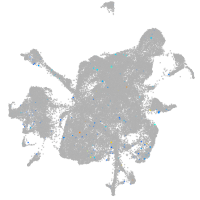
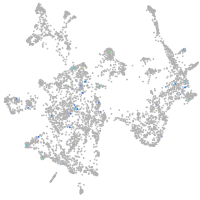
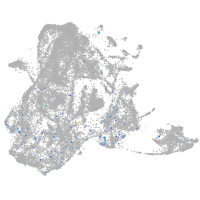
Gene expression UMAP
Display:
Expression
Stage
Other cell groups
all cells
blastomeres
PGCs
endoderm
axial mesoderm
muscle
mural cells /
non-skeletal muscle
mesenchyme
hematopoietic /
vasculature
pronephros
neural
spinal cord / glia
eye
taste / olfactory
otic / lateral line
epidermis
periderm
fin
ionocytes / mucous
pigment cells
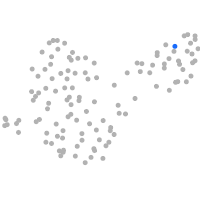
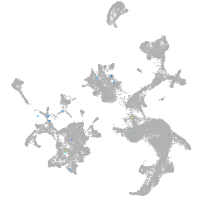
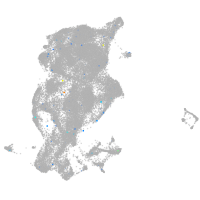
Expression by stage/cluster
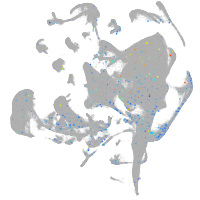
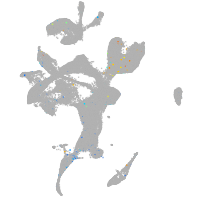
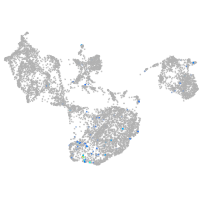
Correlated gene expression
Positive correlation
Negative correlation
Gene
r
Gene
r
LOC101882968
0.251
rpl31
-0.023
LOC108190036
0.199
cyt1
-0.022
si:ch73-249k16.4
0.191
zgc:193505
-0.020
grm6a
0.156
si:ch211-195b11.3
-0.020
CU571163.1
0.150
rpl7
-0.020
macf1b
0.135
krtt1c19e
-0.020
togaram1
0.134
smdt1b
-0.019
CU234171.1
0.133
rpl35
-0.018
cryba1a
0.118
rps26
-0.017
trpm3
0.109
wu:fb18f06
-0.016
LOC100331556
0.109
krt4
-0.016
CABZ01064472.1
0.108
rps8a
-0.016
cacna2d1a
0.105
map1lc3b
-0.015
inpp5jb
0.102
si:ch211-157c3.4
-0.015
tnip2
0.102
eif3i
-0.015
sprn2
0.101
zgc:163030
-0.015
mir92a-1
0.098
rps27.2
-0.014
kcnf1b
0.098
krt5
-0.014
stc1
0.097
rps7
-0.014
LO018422.1
0.096
zgc:175088
-0.014
BX510917.1
0.092
rps12
-0.014
spns3
0.091
mrps11
-0.014
notum2
0.091
rps23
-0.014
BX510301.2
0.090
cyt1l
-0.013
ntrk2b
0.090
psma4
-0.013
CABZ01090785.1
0.088
glo1
-0.013
XLOC-024825
0.087
s100v2
-0.013
fgf1b
0.085
nipsnap2
-0.012
plat
0.085
rps4x
-0.012
si:dkey-18j18.3
0.085
cavin2a
-0.012
BX276101.1
0.085
coa6
-0.012
tmem41ab
0.084
mphosph6
-0.012
c3a.6
0.083
med11
-0.012
CR854927.2
0.083
si:ch211-210c8.7
-0.012
yrk
0.083
adi1
-0.012