Daniocell
ndnf (ionocytes / mucous-producing)
neuron-derived neurotrophic factor
ZFIN
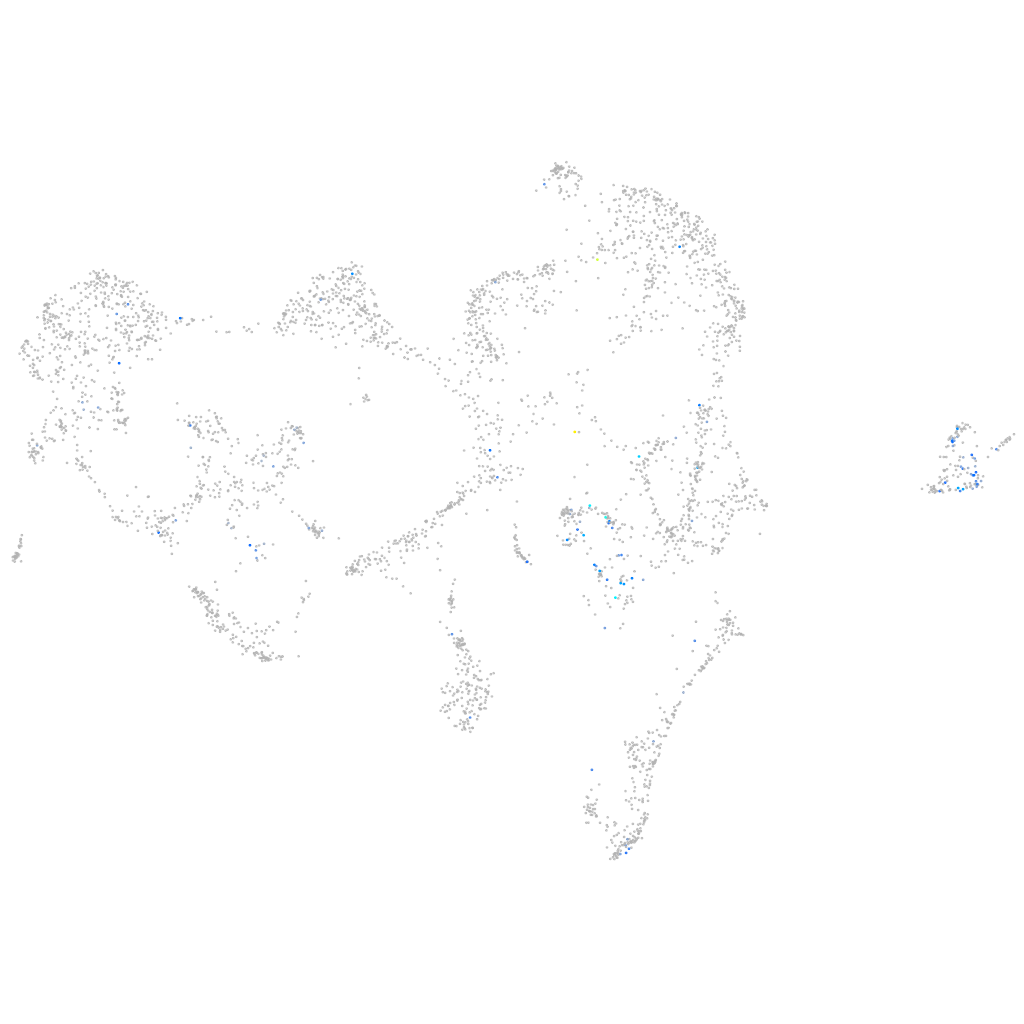
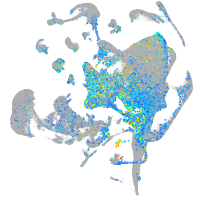
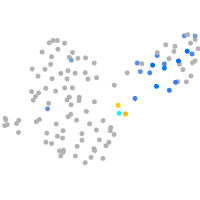
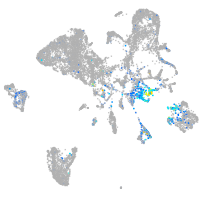
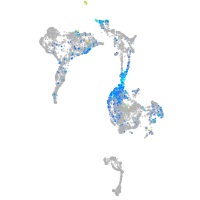
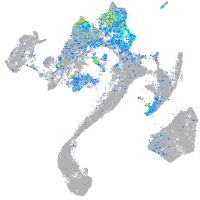
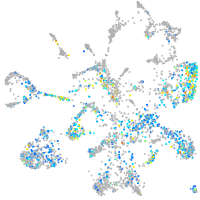
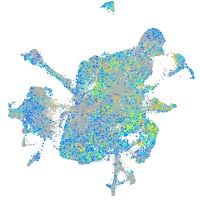
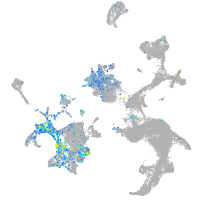
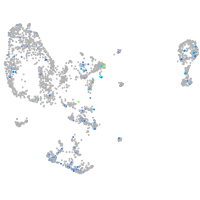
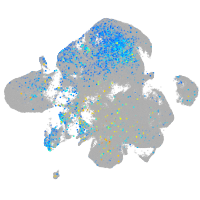
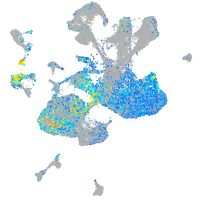
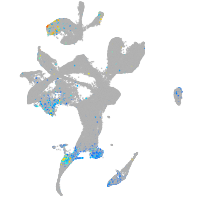
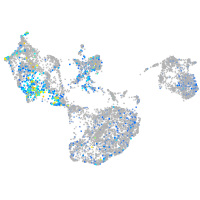
Gene expression UMAP
Display:
Expression
Stage
Other cell groups
all cells
blastomeres
PGCs
endoderm
axial mesoderm
muscle
mural cells /
non-skeletal muscle
mesenchyme
hematopoietic /
vasculature
pronephros
neural
spinal cord / glia
eye
taste / olfactory
otic / lateral line
epidermis
periderm
fin
ionocytes / mucous
pigment cells
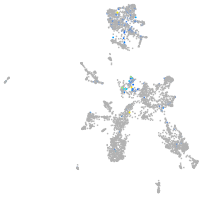
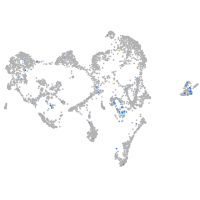
Expression by stage/cluster
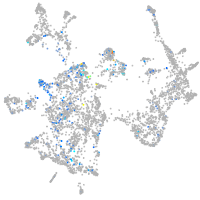
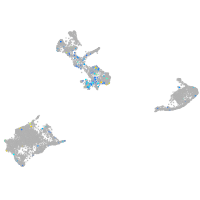
Correlated gene expression
Positive correlation
Negative correlation
Gene
r
Gene
r
LOC110439975
0.305
cldnb
-0.106
col8a2
0.288
cldnh
-0.098
si:dkeyp-117b11.2
0.288
wu:fb18f06
-0.095
ptch2
0.285
selenow1
-0.082
bdkrb2
0.281
BX000438.2
-0.079
BX510657.1
0.281
si:ch211-195b11.3
-0.077
fam155a.1
0.277
cldne
-0.075
si:dkey-1j5.4
0.276
cldn7b
-0.075
sb:cb81
0.265
krt4
-0.073
ntn2
0.262
si:ch211-79k12.1
-0.072
gdf5
0.259
si:ch73-347e22.8
-0.069
grifin
0.254
si:dkey-87o1.2
-0.069
cpxm1a
0.252
ap1s3b
-0.067
spam1
0.248
cyt1
-0.065
cadm1a
0.248
tuba8l2
-0.064
wfikkn2a
0.246
spint2
-0.064
cdh11
0.238
atp5md
-0.064
hapln1a
0.229
zgc:110333
-0.063
CU104782.1
0.228
krt8
-0.063
LOC100004392
0.228
aldob
-0.062
si:ch73-30b17.2
0.226
prrg2
-0.061
si:ch211-28p3.4
0.226
mgst1.2
-0.060
hspb15
0.225
cyt1l
-0.060
cd81a
0.225
crybg1b
-0.059
pdgfra
0.224
vamp8
-0.059
ptprz1b
0.223
f2rl1.2
-0.059
LOC100334706
0.222
soul2
-0.058
tnc
0.217
krt97
-0.058
gpr37l1b
0.214
icn
-0.058
pdgfrb
0.214
zgc:193505
-0.058
grap2a
0.213
bik
-0.057
si:ch211-193l2.6
0.208
anxa1c
-0.057
qkib
0.207
f11r.1
-0.057
ctgfb
0.207
nqo1
-0.057
CU929237.1
0.206
sypl2a
-0.056