
neuron navigator 3
ZFIN 
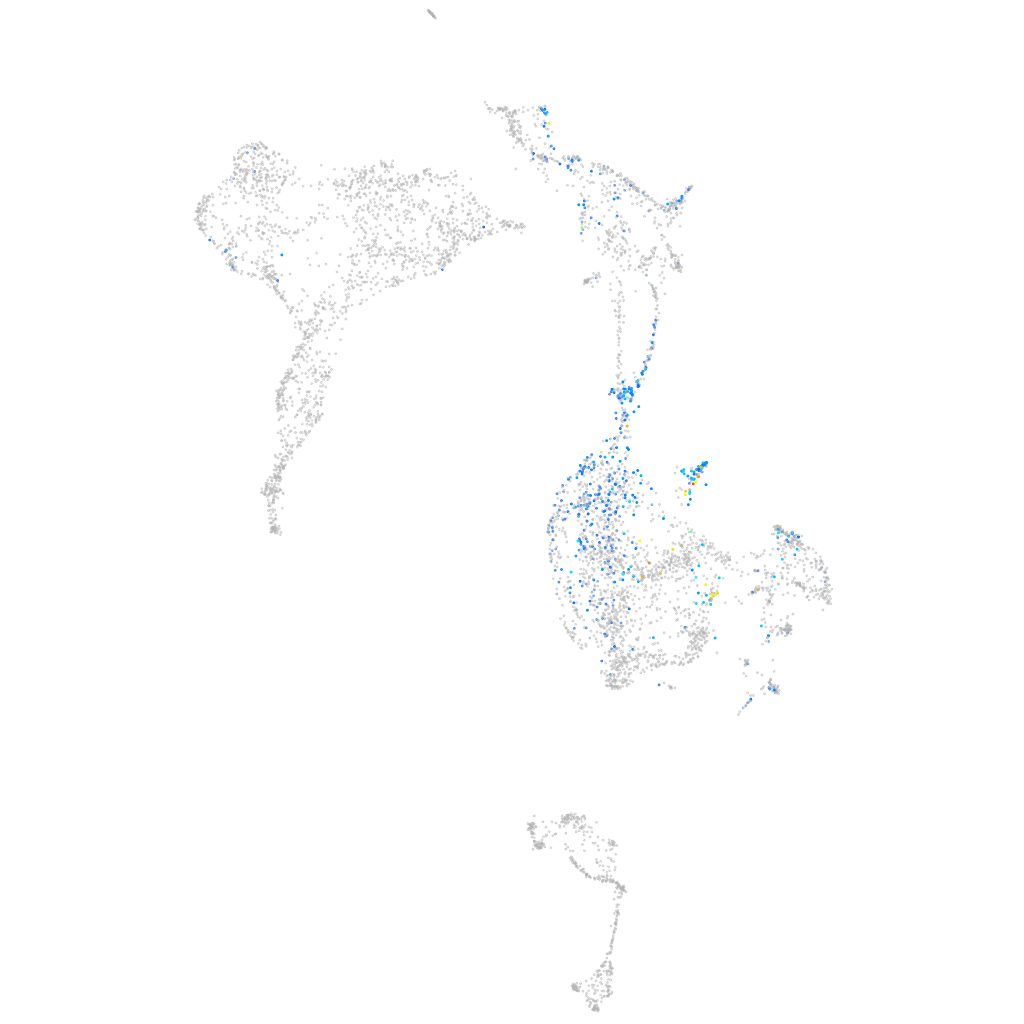
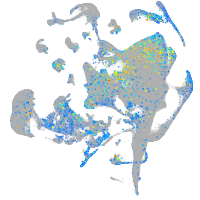
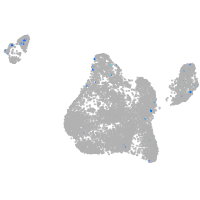
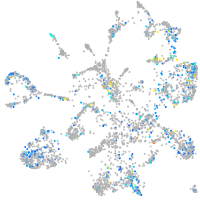
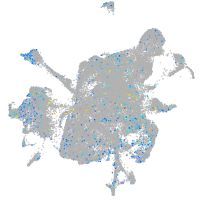
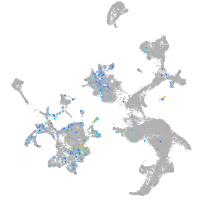
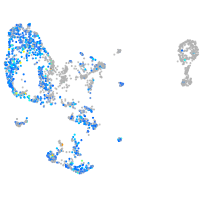
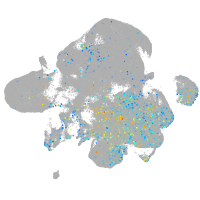
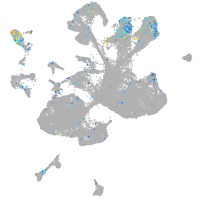
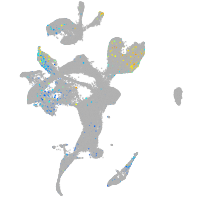
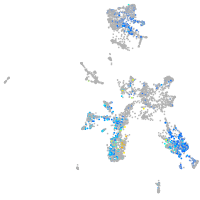
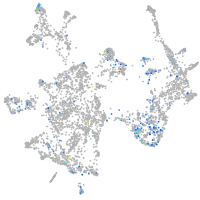
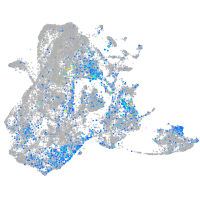
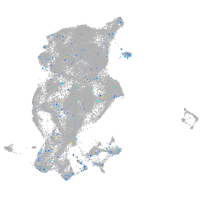
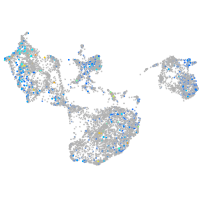
Gene expression UMAP


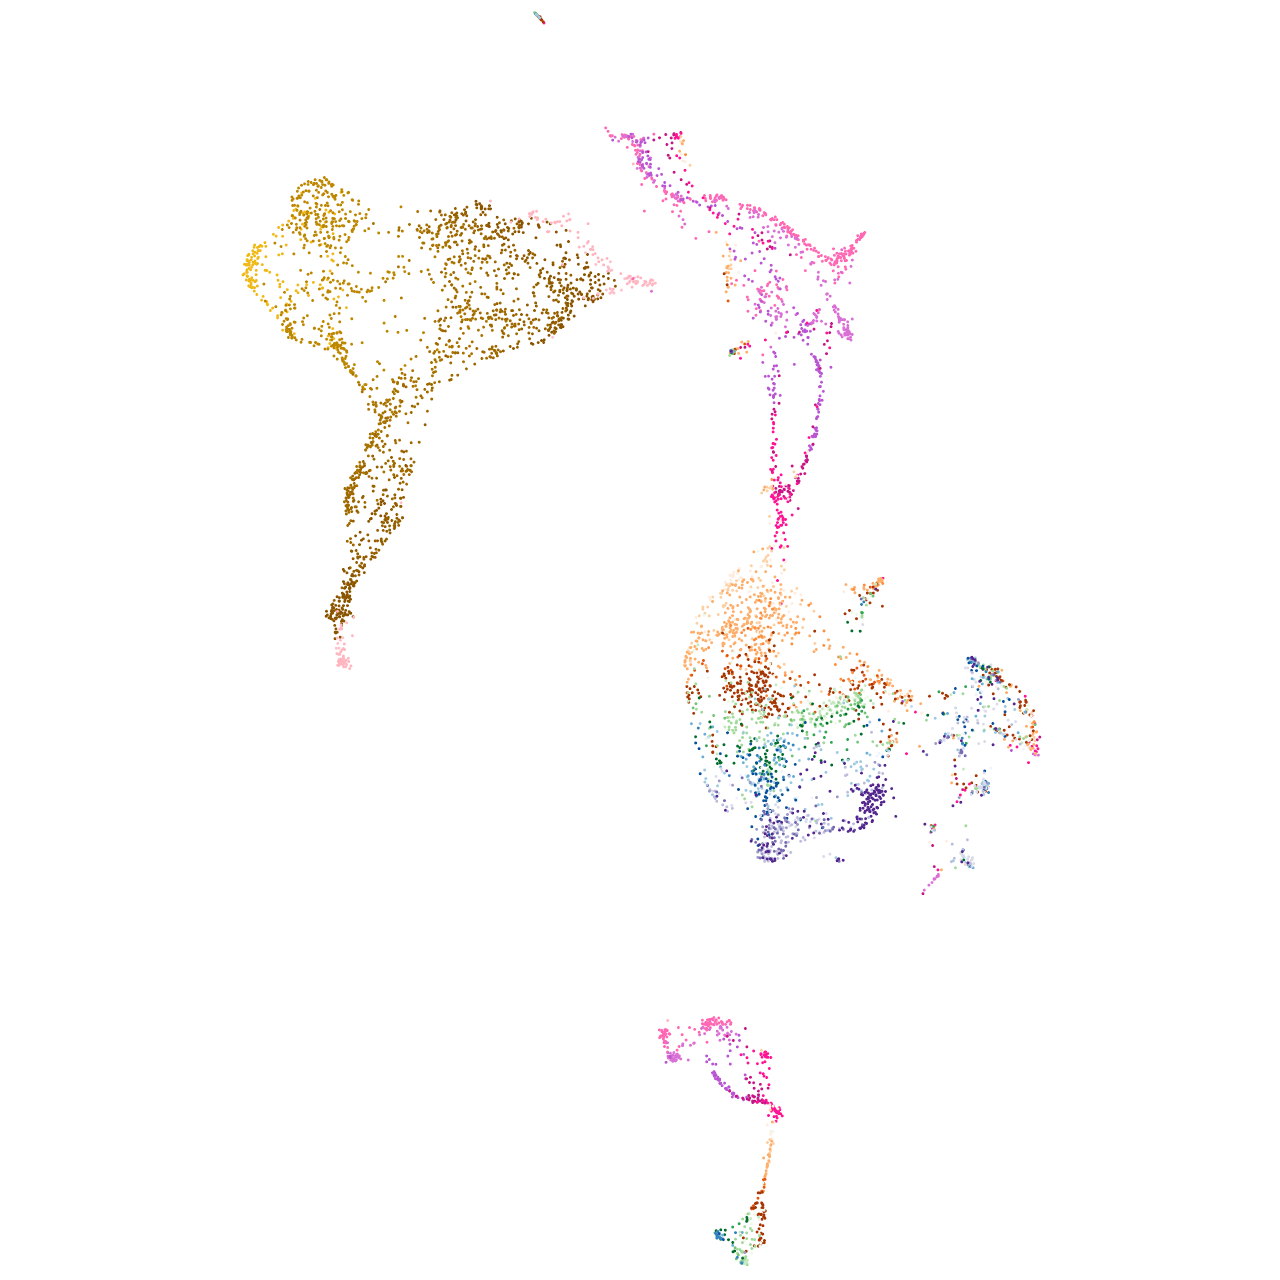

Expression by stage/cluster
Correlated gene expression
| Positive correlation | Negative correlation | ||
| Gene | r | Gene | r |
| matn4 | 0.335 | hspb1 | -0.183 |
| snorc | 0.287 | npm1a | -0.173 |
| tagln | 0.271 | hnrnpabb | -0.166 |
| flna | 0.263 | anp32e | -0.166 |
| cav2 | 0.252 | ncl | -0.165 |
| col2a1b | 0.251 | hnrnpub | -0.164 |
| tpm4a | 0.251 | nop58 | -0.160 |
| chadla | 0.249 | nop56 | -0.160 |
| col8a1a | 0.247 | rsl1d1 | -0.160 |
| entpd5a | 0.246 | ilf3b | -0.160 |
| susd5 | 0.244 | aldob | -0.158 |
| ctgfa | 0.244 | stm | -0.158 |
| ehd2b | 0.243 | snu13b | -0.155 |
| wwp2 | 0.240 | dkc1 | -0.154 |
| cyr61 | 0.237 | fbl | -0.154 |
| tgfbi | 0.231 | syncrip | -0.154 |
| col9a2 | 0.230 | rbm8a | -0.152 |
| acta1a | 0.230 | hnrnpa1b | -0.152 |
| col11a2 | 0.230 | rbm4.3 | -0.150 |
| gas2b | 0.230 | hnrnpa1a | -0.149 |
| col2a1a | 0.228 | fam50a | -0.148 |
| col9a1b | 0.228 | zmat2 | -0.148 |
| zmp:0000000760 | 0.225 | ebna1bp2 | -0.147 |
| col11a1a | 0.225 | cited4b | -0.146 |
| aplp2 | 0.224 | gar1 | -0.146 |
| thbs1a | 0.222 | seta | -0.145 |
| loxl2b | 0.221 | srrm1 | -0.144 |
| cav1 | 0.221 | eif5 | -0.144 |
| fkbp9 | 0.221 | srsf1a | -0.143 |
| col9a3 | 0.220 | brd3a | -0.142 |
| sox9a | 0.217 | magoh | -0.141 |
| myl9a | 0.216 | ddx18 | -0.141 |
| apcdd1l | 0.216 | ppig | -0.141 |
| loxl1 | 0.216 | hmga1a | -0.140 |
| cnmd | 0.215 | srsf2a | -0.140 |