Daniocell
narfl (epidermis)
nuclear prelamin A recognition factor-like
ZFIN
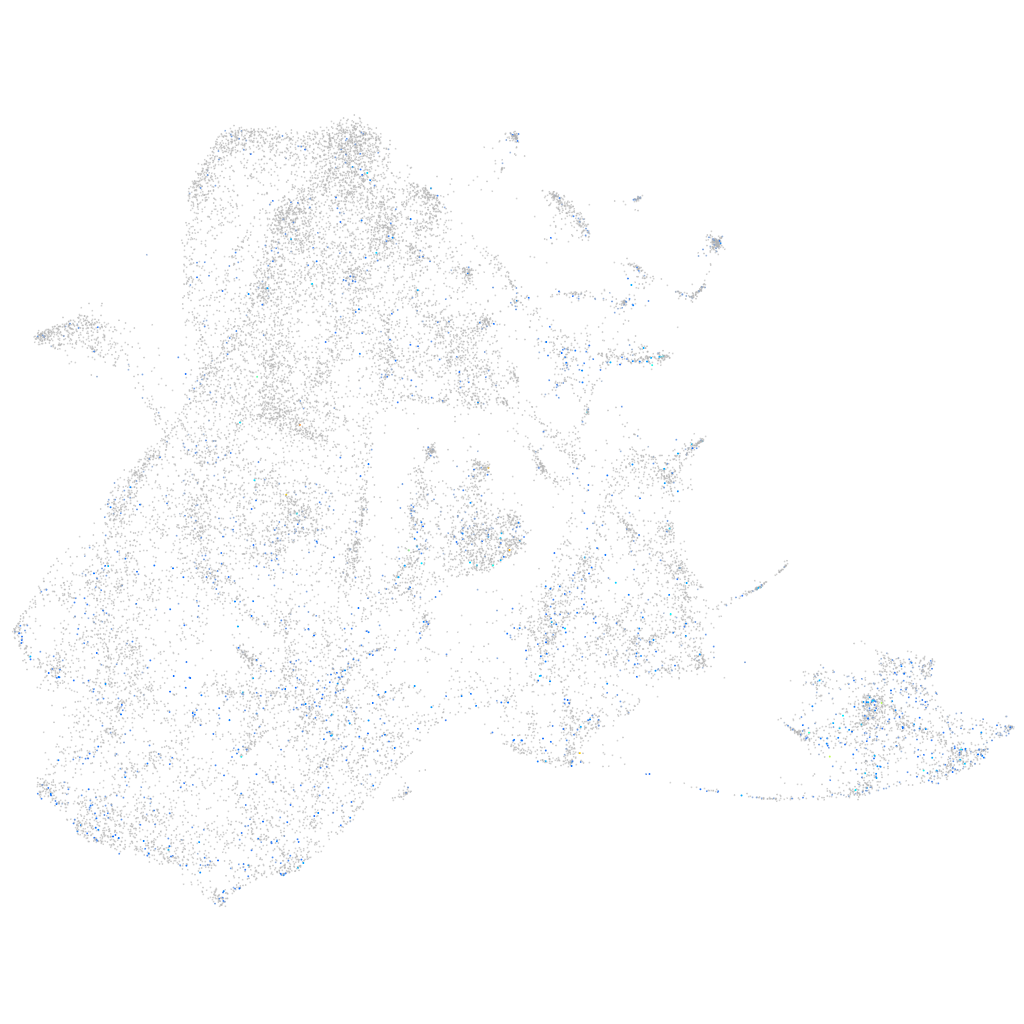
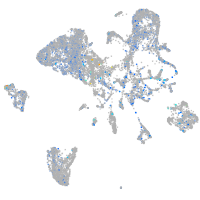
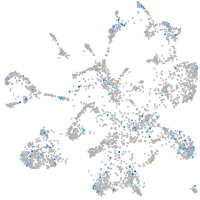
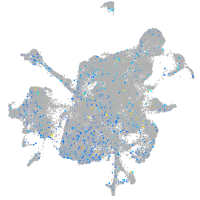
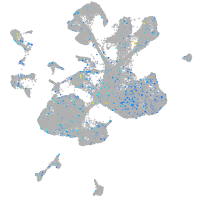
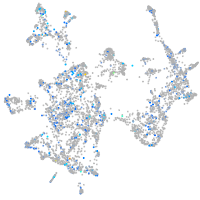
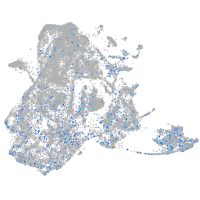
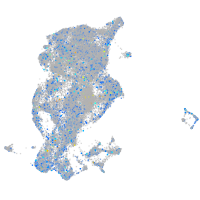
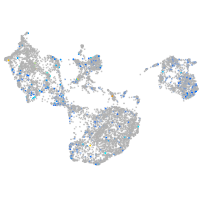
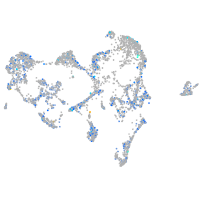
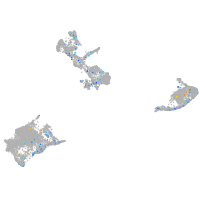
Gene expression UMAP
Display:
Expression
Stage
Other cell groups
all cells
blastomeres
PGCs
endoderm
axial mesoderm
muscle
mural cells /
non-skeletal muscle
mesenchyme
hematopoietic /
vasculature
pronephros
neural
spinal cord / glia
eye
taste / olfactory
otic / lateral line
epidermis
periderm
fin
ionocytes / mucous
pigment cells
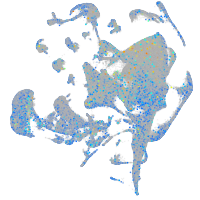
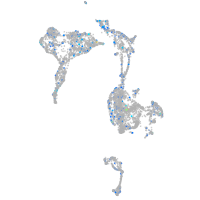
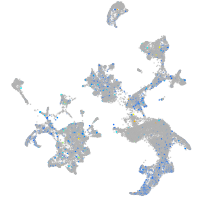
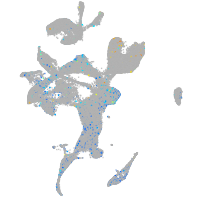
Expression by stage/cluster
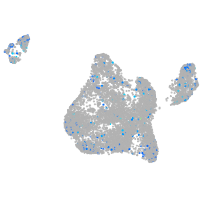
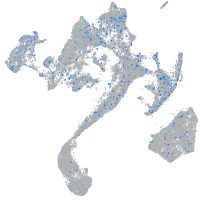
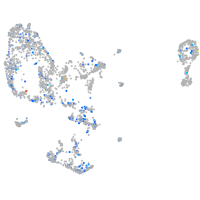
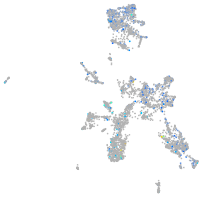
Correlated gene expression
Positive correlation
Negative correlation
Gene
r
Gene
r
si:dkey-87o1.2
0.113
tmsb4x
-0.110
si:ch73-347e22.8
0.113
col1a2
-0.106
cldnb
0.110
col1a1b
-0.103
cldne
0.110
sparc
-0.100
hmgn2
0.106
pfn1
-0.100
nqo1
0.105
cldn1
-0.098
gmds
0.105
col1a1a
-0.097
hsd17b12a
0.104
krt5
-0.097
cldn23a
0.102
rbp4
-0.097
XLOC-044316
0.102
col11a1a
-0.095
zgc:110333
0.099
krt91
-0.093
si:ch73-204p21.2
0.097
si:dkey-33c14.3
-0.092
styk1b
0.096
postnb
-0.091
zgc:136892
0.096
si:dkey-16p21.8
-0.090
zgc:153665
0.096
krtt1c19e
-0.087
s100u
0.096
ecrg4b
-0.087
fuca1.1
0.096
cotl1
-0.086
anxa1b
0.096
col2a1b
-0.085
si:ch211-195b11.3
0.095
col4a5
-0.081
si:ch211-286b5.5
0.095
zgc:86896
-0.081
lye
0.095
zgc:136930
-0.080
cd9b
0.095
cxl34b.11
-0.080
ap1s3b
0.094
col14a1b
-0.080
XLOC-027129
0.094
spaca4l
-0.080
tubb2b
0.094
aqp3a
-0.079
selenow2b
0.094
itgb4
-0.077
si:ch211-157c3.4
0.094
lgals1l1
-0.076
anxa1c
0.093
si:dkey-183i3.5
-0.075
stx11b.1
0.093
wu:fa03e10
-0.075
h3f3a
0.093
col17a1a
-0.074
tprg1
0.093
flna
-0.074
stard14
0.093
aep1
-0.073
ANXA1 (1 of many)
0.092
cldni
-0.071
si:ch211-217k17.9
0.092
hcls1
-0.070
scel
0.092
itgb3a
-0.070