Daniocell
msto1 (taste / olfactory)
misato mitochondrial distribution and morphology regulator 1
ZFIN
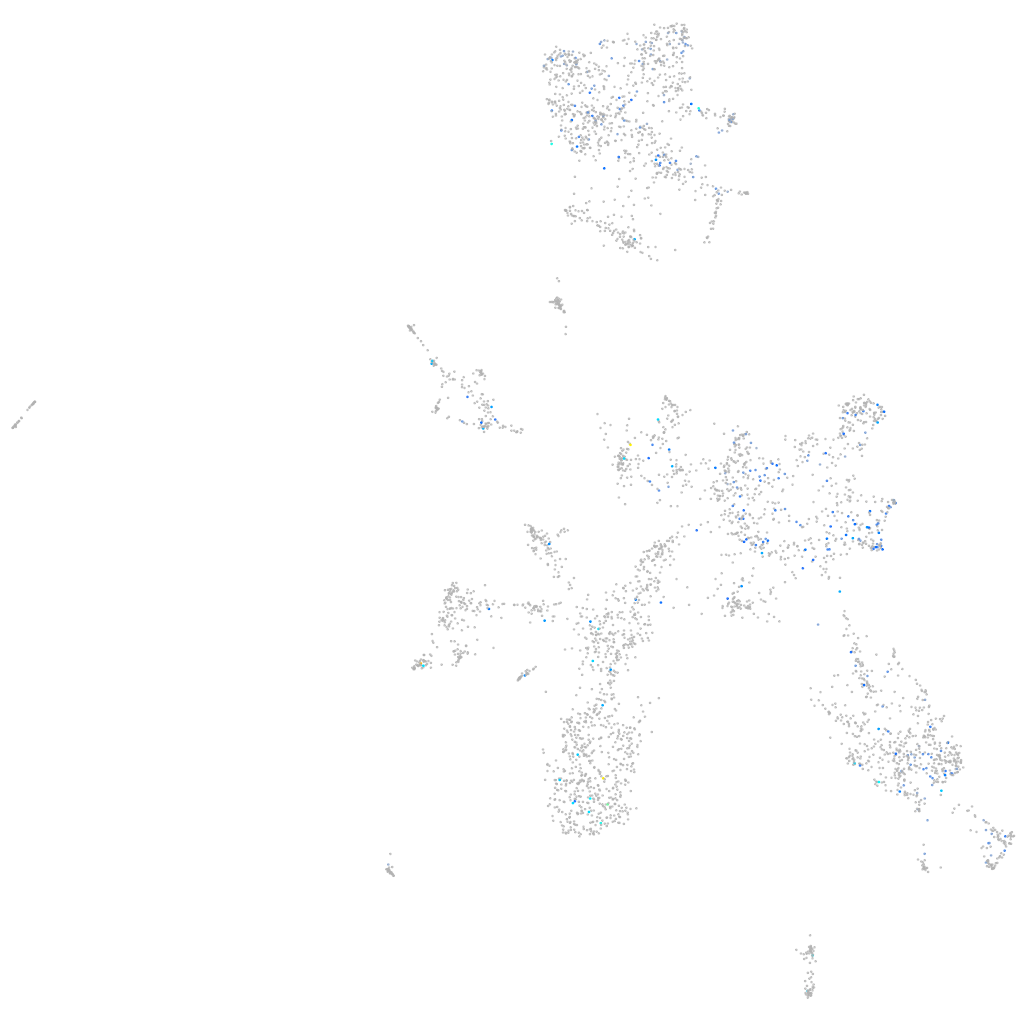
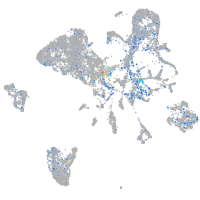
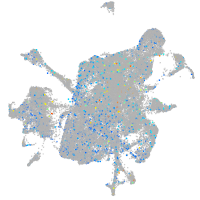
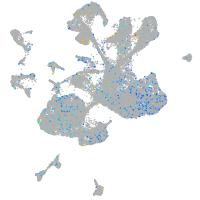
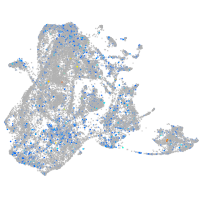
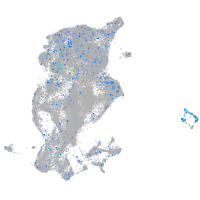
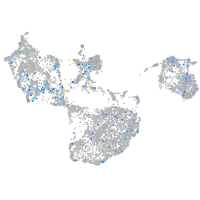
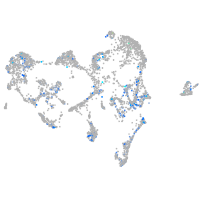
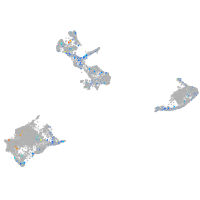
Gene expression UMAP
Display:
Expression
Stage
Other cell groups
all cells
blastomeres
PGCs
endoderm
axial mesoderm
muscle
mural cells /
non-skeletal muscle
mesenchyme
hematopoietic /
vasculature
pronephros
neural
spinal cord / glia
eye
taste / olfactory
otic / lateral line
epidermis
periderm
fin
ionocytes / mucous
pigment cells
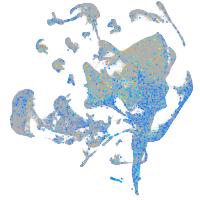
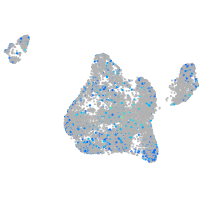
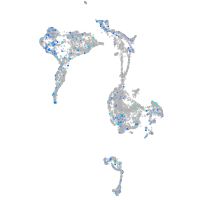
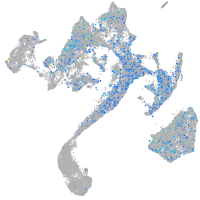
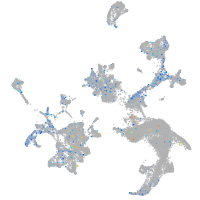
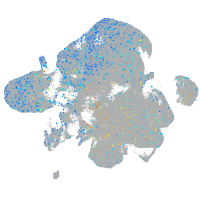
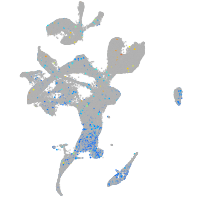
Expression by stage/cluster
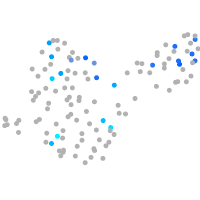
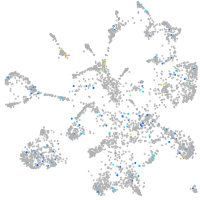
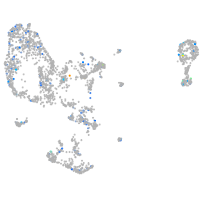
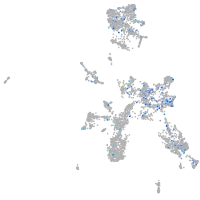
Correlated gene expression
Positive correlation
Negative correlation
Gene
r
Gene
r
LOC101883824
0.179
CR383676.1
-0.064
tacr3l
0.174
ebf3a
-0.055
XLOC-015260
0.166
atp2b1a
-0.055
XLOC-014466
0.155
zgc:65894
-0.054
trim110
0.155
vamp2
-0.053
nr0b2a
0.153
atp6v0ca
-0.052
si:ch211-249h16.8
0.145
rnasekb
-0.051
kcna6a
0.144
si:dkey-28b4.7
-0.051
hoxc13a
0.139
atp6v0cb
-0.051
c1qb
0.136
kif5bb
-0.050
taar10
0.135
camk2n1a
-0.049
lrrc66
0.125
carmil2
-0.048
impg2a
0.125
LOC100537342
-0.048
si:dkey-6n6.1
0.120
baz2ba
-0.046
CABZ01044765.1
0.120
lhx2b
-0.046
CABZ01015815.2
0.119
ebf1b
-0.046
ddx28
0.118
cnrip1a
-0.045
si:dkey-35m8.1
0.116
clstn1
-0.045
CABZ01043506.2
0.115
znfl1l
-0.044
sele
0.115
rab40b
-0.044
npm1a
0.115
si:dkey-153k10.9
-0.044
CU695207.1
0.115
stx2b
-0.044
cdca7b
0.114
map1lc3b
-0.044
valopa
0.114
rtn1a
-0.043
XLOC-033953
0.114
cldnh
-0.043
LOC101883600
0.113
zgc:172182
-0.043
BX927184.1
0.113
foxp1a
-0.043
BX649300.2
0.112
wu:fj13e08
-0.043
fbl
0.112
wdr60
-0.042
nop58
0.112
actc1b
-0.042
plppr5a
0.111
klf7a
-0.042
hoxd11a
0.110
si:dkeyp-75h12.5
-0.042
CABZ01077220.1
0.109
hbbe3
-0.042
parp1
0.106
TSTA3 (1 of many)
-0.042
CR925804.1
0.104
egr4
-0.041