
mitochondrial ribosomal protein L1
ZFIN 
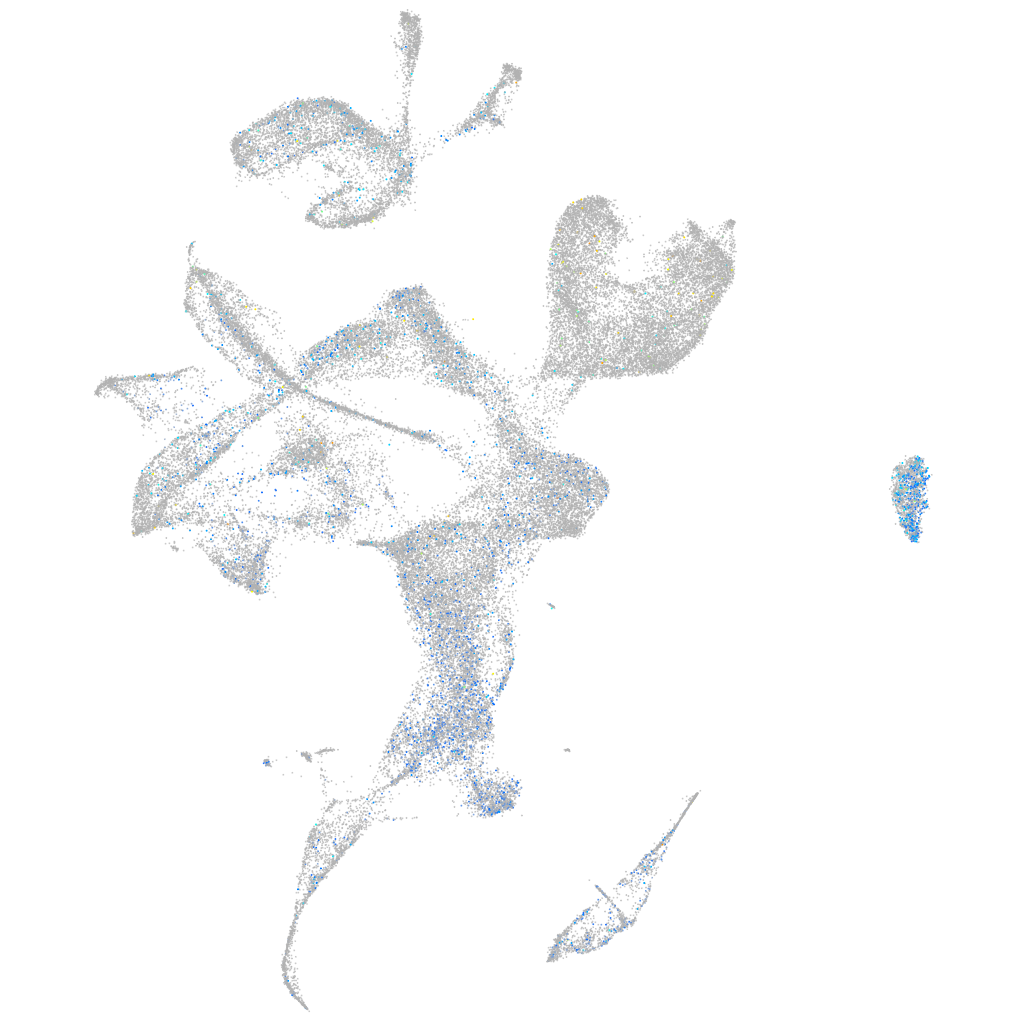
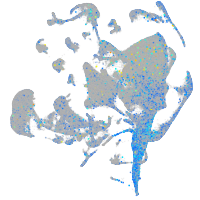
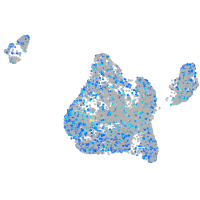
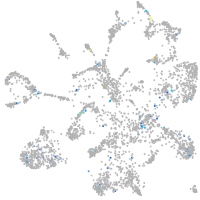
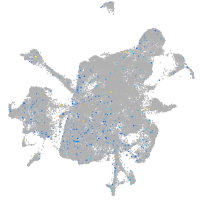
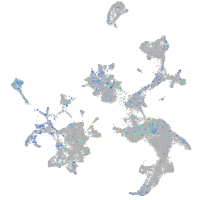
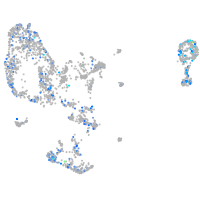
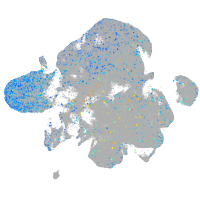
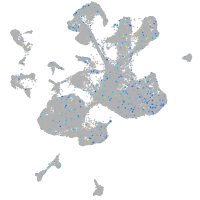
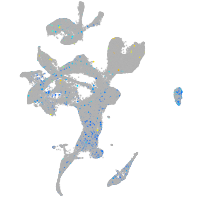
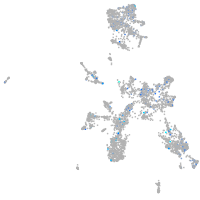
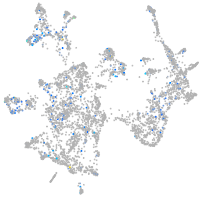
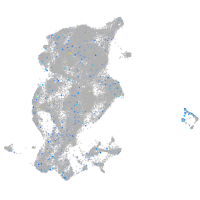
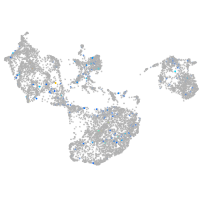
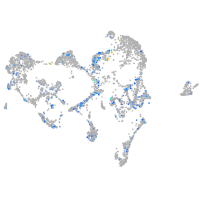
Gene expression UMAP


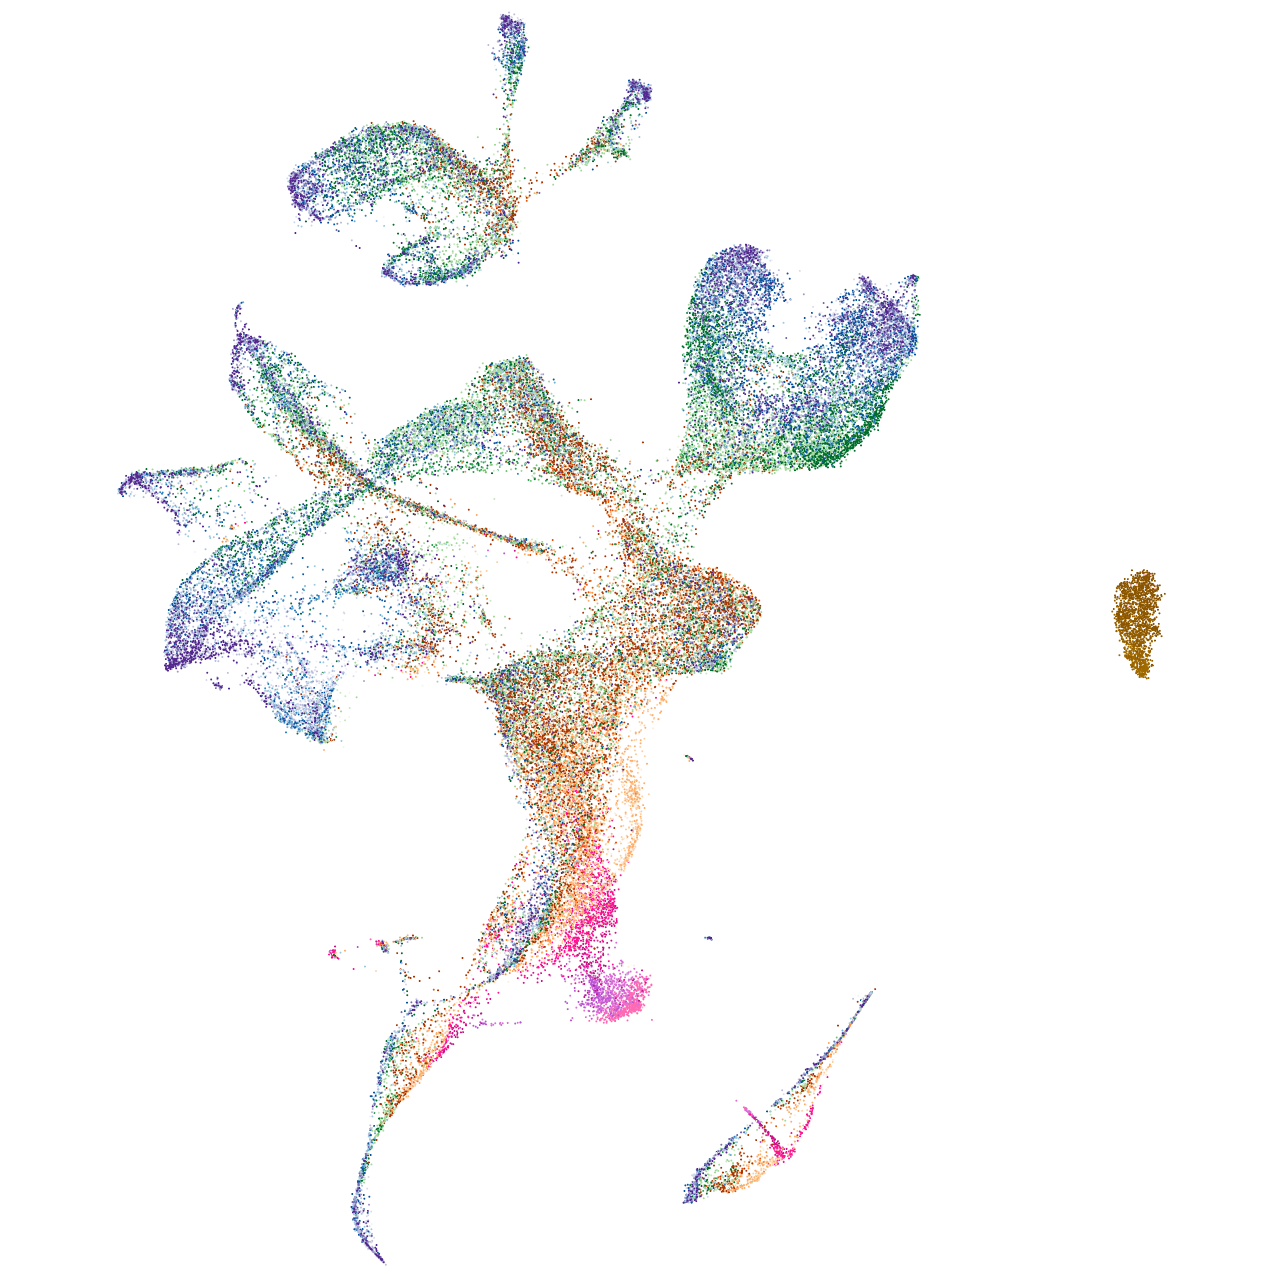


Expression by stage/cluster
Correlated gene expression
| Positive correlation | Negative correlation | ||
| Gene | r | Gene | r |
| fbl | 0.141 | CR383676.1 | -0.094 |
| nop58 | 0.139 | ptmaa | -0.078 |
| hspb1 | 0.137 | pvalb1 | -0.069 |
| npm1a | 0.137 | ckbb | -0.067 |
| dkc1 | 0.135 | gpm6aa | -0.067 |
| nop2 | 0.133 | pvalb2 | -0.066 |
| gnl3 | 0.129 | actc1b | -0.064 |
| ncl | 0.125 | marcksl1a | -0.059 |
| nop56 | 0.123 | h3f3c | -0.058 |
| si:ch211-152c2.3 | 0.123 | gpm6ab | -0.058 |
| zmp:0000000624 | 0.122 | vsx1 | -0.056 |
| snu13b | 0.122 | ndrg4 | -0.055 |
| bms1 | 0.121 | ppdpfb | -0.052 |
| rsl1d1 | 0.120 | mylpfa | -0.051 |
| pprc1 | 0.119 | rnasekb | -0.050 |
| si:ch211-217k17.7 | 0.119 | neurod4 | -0.050 |
| ddx18 | 0.118 | gng13b | -0.050 |
| ebna1bp2 | 0.118 | scrt2 | -0.050 |
| pes | 0.117 | histh1l | -0.049 |
| mybbp1a | 0.117 | epb41a | -0.048 |
| shisa2a | 0.116 | ip6k2b | -0.048 |
| stm | 0.115 | calb2b | -0.047 |
| mphosph10 | 0.114 | ip6k2a | -0.047 |
| gar1 | 0.114 | gnb3a | -0.047 |
| nop10 | 0.112 | hbae3 | -0.047 |
| rrp1 | 0.112 | hbbe1.3 | -0.047 |
| nhp2 | 0.111 | ccng2 | -0.047 |
| apoeb | 0.111 | snap25b | -0.046 |
| cyp26a1 | 0.111 | rtn1a | -0.045 |
| tdgf1 | 0.109 | calm1a | -0.045 |
| sox19a | 0.109 | atp6v0cb | -0.045 |
| ddx24 | 0.109 | krt4 | -0.044 |
| nr6a1a | 0.109 | lin7a | -0.044 |
| wdr43 | 0.108 | cyt1 | -0.043 |
| lyar | 0.108 | stmn1b | -0.043 |