Daniocell
mpg (mesenchyme)
N-methylpurine DNA glycosylase
ZFIN
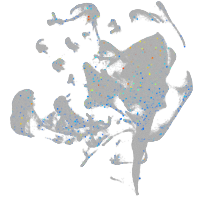
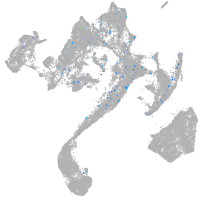
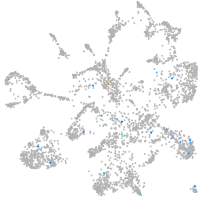
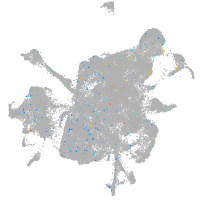
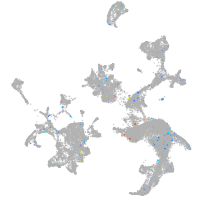
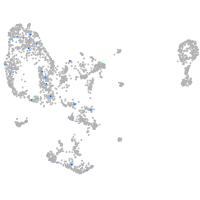
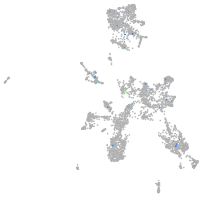
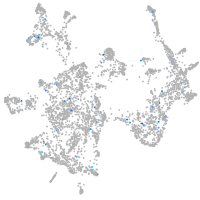
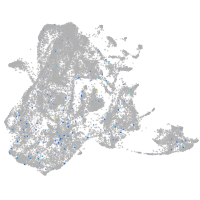
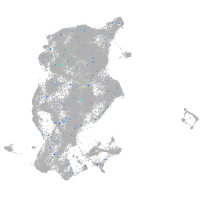
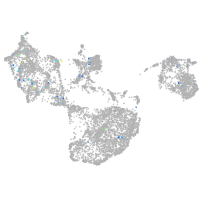
Gene expression UMAP
Display:
Expression
Stage
Other cell groups
all cells
blastomeres
PGCs
endoderm
axial mesoderm
muscle
mural cells /
non-skeletal muscle
mesenchyme
hematopoietic /
vasculature
pronephros
neural
spinal cord / glia
eye
taste / olfactory
otic / lateral line
epidermis
periderm
fin
ionocytes / mucous
pigment cells
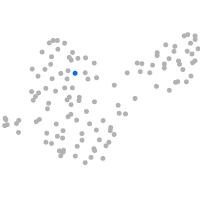
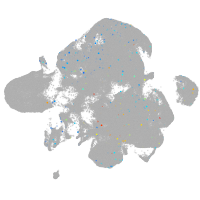
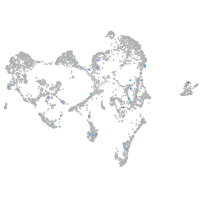
Expression by stage/cluster
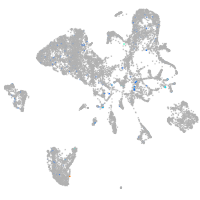
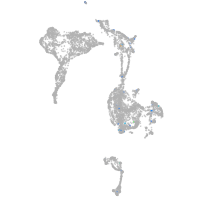
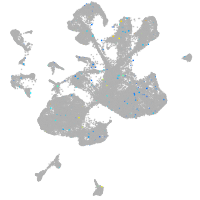
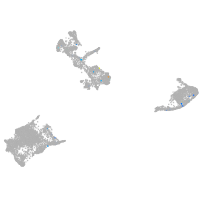
Correlated gene expression
Positive correlation
Negative correlation
Gene
r
Gene
r
CR749763.4
0.126
tmsb4x
-0.018
CR394556.1
0.069
fstl1b
-0.018
XLOC-024017
0.067
serpinh1b
-0.017
si:dkey-3k20.1
0.066
hbbe1.3
-0.016
tdrd5
0.062
zgc:162730
-0.016
CABZ01065684.1
0.058
wnt11r
-0.016
slco1f1
0.056
col1a1b
-0.016
or115-1
0.055
calm1a
-0.016
ca15c
0.053
marcksl1a
-0.015
XLOC-028443
0.052
sparc
-0.015
RF00421
0.049
tspan4a
-0.015
LOC110437988
0.048
kdelr3
-0.015
m17
0.047
gulp1a
-0.014
BX571954.3
0.047
wfdc2
-0.014
abo
0.046
myhz1.1
-0.014
CABZ01058333.1
0.044
prss12
-0.014
LOC103911485
0.044
ca6
-0.014
LOC103910915
0.044
plpp3
-0.014
pstpip1b
0.044
col5a1
-0.014
FP101875.2
0.043
ctgfa
-0.014
BX470188.1
0.043
lum
-0.014
CU062633.1
0.042
ypel1
-0.014
XLOC-037028
0.040
col1a2
-0.013
si:dkeyp-80c12.5
0.040
rbms2a
-0.013
XLOC-043390
0.040
si:dkey-238c7.16
-0.013
LOC101886193
0.039
crabp2a
-0.013
CR293508.1
0.039
c1qtnf2
-0.013
ccr12a
0.039
si:ch211-196l7.4
-0.013
cryba1l2
0.039
zgc:153675
-0.013
si:ch73-7i4.1
0.038
tp53inp1
-0.013
si:ch211-261n11.8
0.038
col1a1a
-0.013
dlx2a
0.038
ost4
-0.013
BX855618.1
0.038
creg2
-0.013
LOC101885725
0.037
cyr61
-0.013
LOC108181544
0.037
serf2
-0.012