Daniocell
mocs3 (blastomeres)
molybdenum cofactor synthesis 3
ZFIN
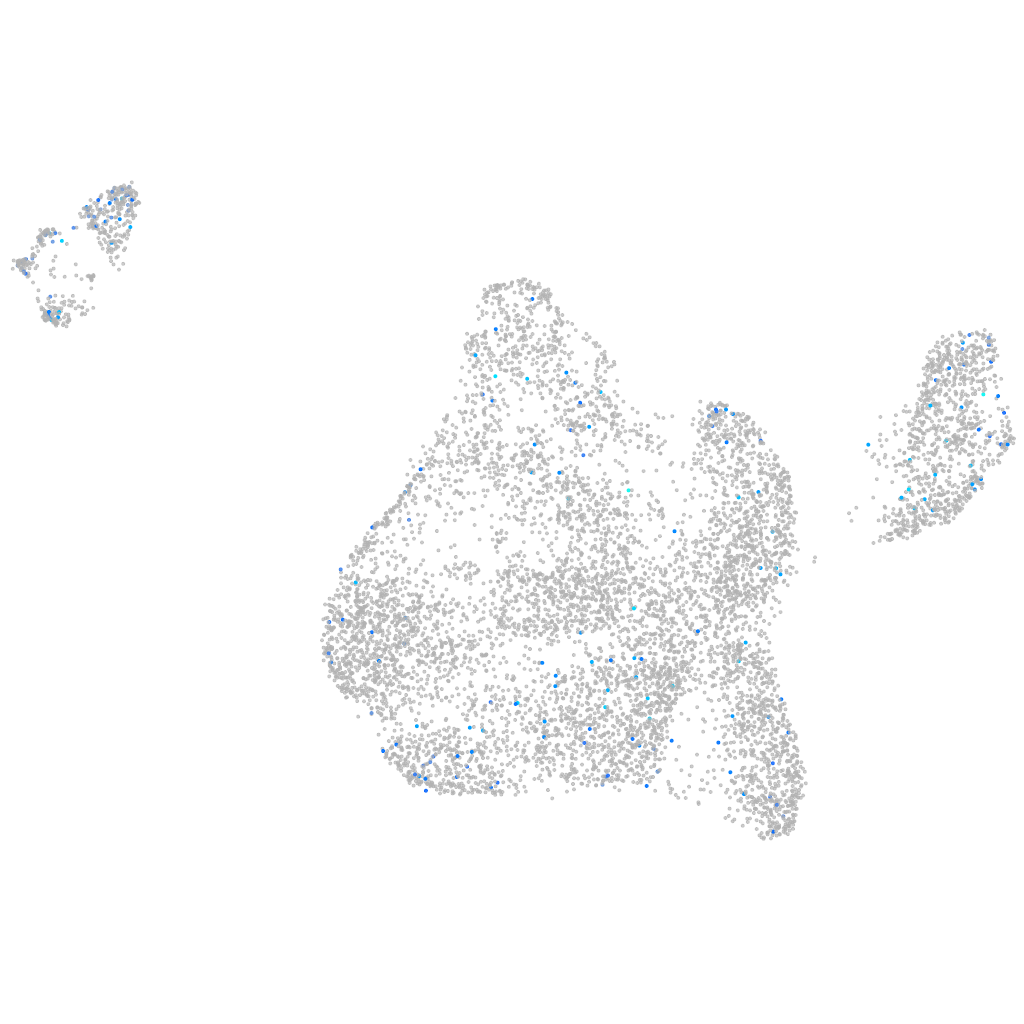
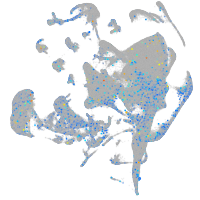
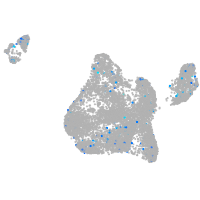
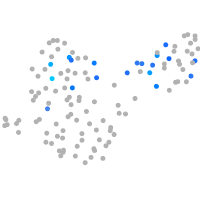
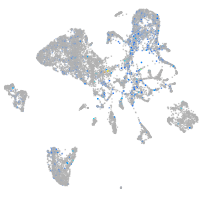
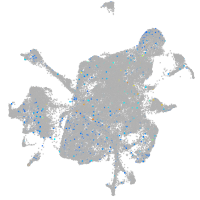
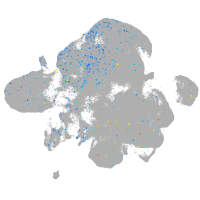
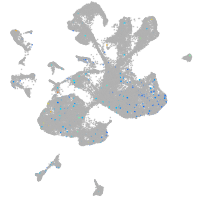
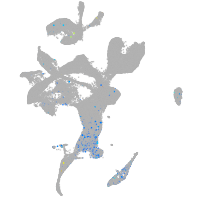
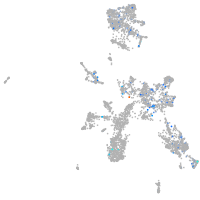
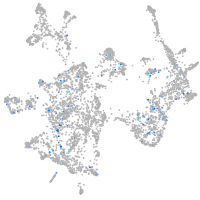
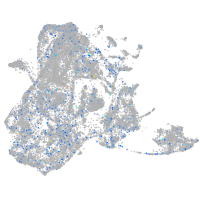
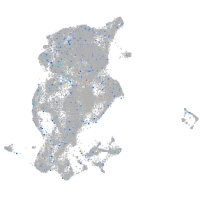
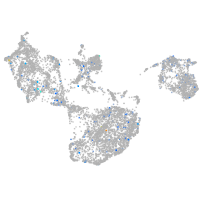
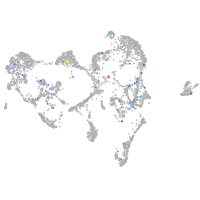
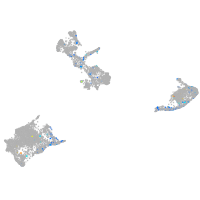
Gene expression UMAP
Display:
Expression
Stage
Other cell groups
all cells
blastomeres
PGCs
endoderm
axial mesoderm
muscle
mural cells /
non-skeletal muscle
mesenchyme
hematopoietic /
vasculature
pronephros
neural
spinal cord / glia
eye
taste / olfactory
otic / lateral line
epidermis
periderm
fin
ionocytes / mucous
pigment cells
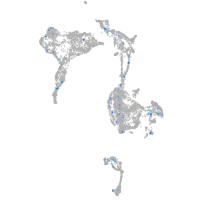
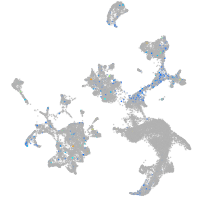
Expression by stage/cluster
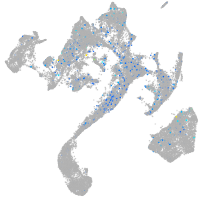
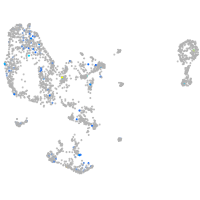
Correlated gene expression
Positive correlation
Negative correlation
Gene
r
Gene
r
EGFLAM
0.109
hspb1
-0.086
dpep1
0.109
si:ch211-222l21.1
-0.081
myo15ab
0.107
si:ch73-1a9.3
-0.079
si:dkey-85k7.11
0.097
stm
-0.079
ccl33.2
0.095
hmgb2a
-0.078
BX649411.1
0.094
eef1a1l1
-0.073
CR555293.1
0.091
dynll1
-0.071
LOC103909114
0.089
hnrnpa0b
-0.070
si:dkey-40g16.5
0.088
si:ch211-152c2.3
-0.070
zgc:113424
0.088
marcksl1b
-0.069
CU682604.1
0.087
anp32e
-0.067
igfbp5a
0.086
aldob
-0.064
myo1ha
0.086
ptmab
-0.063
fbxo36b
0.085
polr3gla
-0.062
LOC110439350
0.083
hmga1a
-0.062
klhl18
0.083
ybx1
-0.062
grk1b
0.083
tuba8l4
-0.060
rgs9b
0.083
rplp1
-0.060
maco1a
0.082
anp32a
-0.059
pja2
0.082
si:dkey-151g10.6
-0.057
zgc:153395
0.082
add3b
-0.057
si:zfos-1897c11.1
0.081
rps19
-0.057
acp5a
0.080
rps4x
-0.056
CR385053.2
0.080
rpl10
-0.055
CR931980.1
0.080
rplp2l
-0.055
v2ra17
0.079
hmgn6
-0.055
scrt1b
0.078
npm1a
-0.054
si:dkeyp-4f2.1
0.078
akap12b
-0.053
BX664750.3
0.078
rpl32
-0.052
tgfa
0.078
naca
-0.051
LOC101885637
0.077
anp32b
-0.051
mknk2a
0.077
rps13
-0.051
ugt5d1
0.077
khdrbs1a
-0.051
si:dkey-7i4.11
0.077
cox7c
-0.050
si:ch211-199g17.2
0.077
rps15a
-0.049